OPEN-SOURCE SCRIPT
ZoneBars
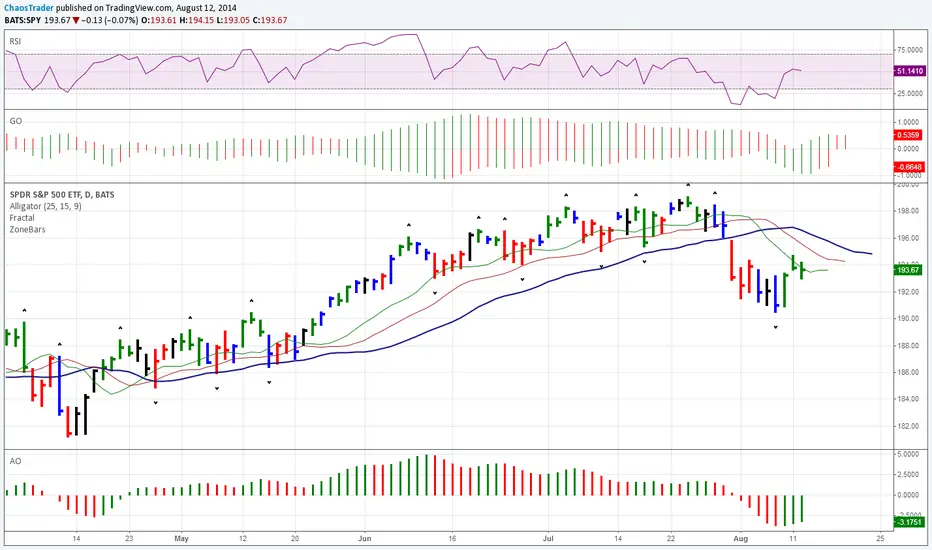
Bill Williams Zone and Squat Bars. See New Trading Dimensions by Bill Williams, PhD.
Bars are green (green zone) when the Awesome Oscillator and Accelerator/Decelerator are both positive.
Bars are red (red zone) when the Awesome Oscillator and Accelerator/Decelerator are both negative.
Bars are blue when a squat bar is formed, these indicate a battle between bulls and bears and often happen near trend continuation or trend changes.
Caution: Assumes chart is a bar chart - not a candle chart.
Caution: Squat bars are accurate only with official exchange volume data - BATS data will give false squat bars.
オープンソーススクリプト
TradingViewの精神に則り、このスクリプトの作者はコードをオープンソースとして公開してくれました。トレーダーが内容を確認・検証できるようにという配慮です。作者に拍手を送りましょう!無料で利用できますが、コードの再公開はハウスルールに従う必要があります。
免責事項
この情報および投稿は、TradingViewが提供または推奨する金融、投資、トレード、その他のアドバイスや推奨を意図するものではなく、それらを構成するものでもありません。詳細は利用規約をご覧ください。
オープンソーススクリプト
TradingViewの精神に則り、このスクリプトの作者はコードをオープンソースとして公開してくれました。トレーダーが内容を確認・検証できるようにという配慮です。作者に拍手を送りましょう!無料で利用できますが、コードの再公開はハウスルールに従う必要があります。
免責事項
この情報および投稿は、TradingViewが提供または推奨する金融、投資、トレード、その他のアドバイスや推奨を意図するものではなく、それらを構成するものでもありません。詳細は利用規約をご覧ください。