OPEN-SOURCE SCRIPT
Candlestick Pattern Scanner
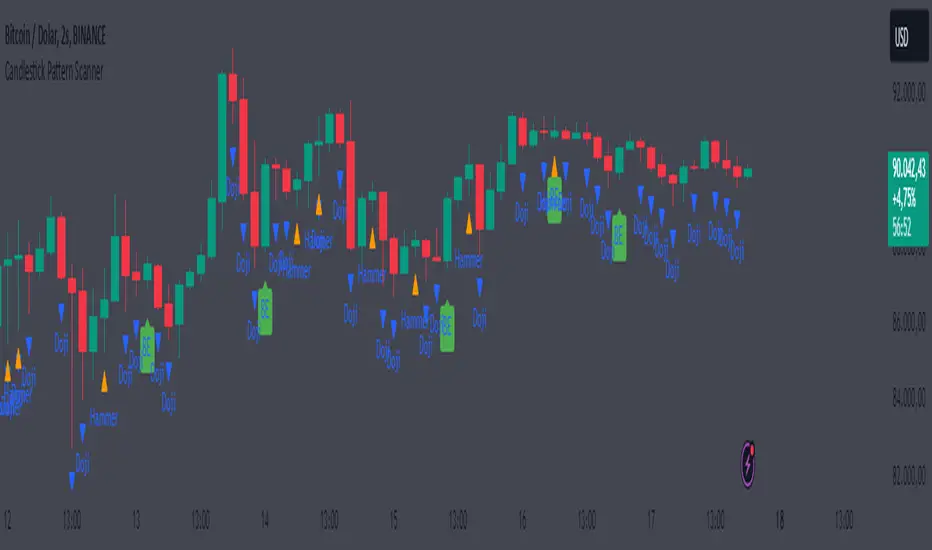
Candlestick Pattern Scanner
This indicator identifies popular candlestick patterns on the chart and provides visual and alert-based support for traders. Based on technical analysis, it provides insights into potential trend reversals or continuation signals in price action. The following patterns are detected and marked:
1. Bullish Engulfing
Definition: Considered a strong bullish signal. A small red candle is followed by a large green candle that completely engulfs the previous one.
Chart Display: Marked with a green arrow below the price bar.
Alert Message: "Bullish Engulfing Pattern Detected!"
2. Bearish Engulfing
Definition: Considered a strong bearish signal. A small green candle is followed by a large red candle that completely engulfs the previous one.
Chart Display: Marked with a red arrow above the price bar.
Alert Message: "Bearish Engulfing Pattern Detected!"
3. Doji
Definition: Indicates indecision in the market. The candlestick has an opening and closing price that are almost the same, forming a very small body.
Chart Display: Marked with a blue triangle below the price bar.
Alert Message: "Doji Pattern Detected!"
4. Hammer
Definition: Can signal a strong bullish reversal. It has a long lower shadow and a small body, often appearing at the end of a downtrend.
Chart Display: Marked with an orange triangle below the price bar.
Alert Message: "Hammer Pattern Detected!"
5. Shooting Star
Definition: Can signal a strong bearish reversal. It has a long upper shadow and a small body, often appearing at the end of an uptrend.
Chart Display: Marked with a purple triangle above the price bar.
Alert Message: "Shooting Star Pattern Detected!"
Features:
Visual Support: Patterns are clearly marked on the chart using distinct shapes (arrows and triangles).
Alerts: Receive real-time notifications through TradingView’s alert system when a pattern is detected.
Versatility: Useful for identifying both trend reversals and continuation signals.
User-Friendly: Patterns are easily distinguishable with unique color coding.
Purpose:
This indicator helps traders identify potential reversal points or strong trend beginnings in price action. It can be used as a supportive tool in scalping, swing trading, or long-term investment strategies.
オープンソーススクリプト
TradingViewの精神に則り、このスクリプトの作者はコードをオープンソースとして公開してくれました。トレーダーが内容を確認・検証できるようにという配慮です。作者に拍手を送りましょう!無料で利用できますが、コードの再公開はハウスルールに従う必要があります。
免責事項
この情報および投稿は、TradingViewが提供または推奨する金融、投資、トレード、その他のアドバイスや推奨を意図するものではなく、それらを構成するものでもありません。詳細は利用規約をご覧ください。
オープンソーススクリプト
TradingViewの精神に則り、このスクリプトの作者はコードをオープンソースとして公開してくれました。トレーダーが内容を確認・検証できるようにという配慮です。作者に拍手を送りましょう!無料で利用できますが、コードの再公開はハウスルールに従う必要があります。
免責事項
この情報および投稿は、TradingViewが提供または推奨する金融、投資、トレード、その他のアドバイスや推奨を意図するものではなく、それらを構成するものでもありません。詳細は利用規約をご覧ください。