OPEN-SOURCE SCRIPT
更新済 Moving Average and Pearson Levels
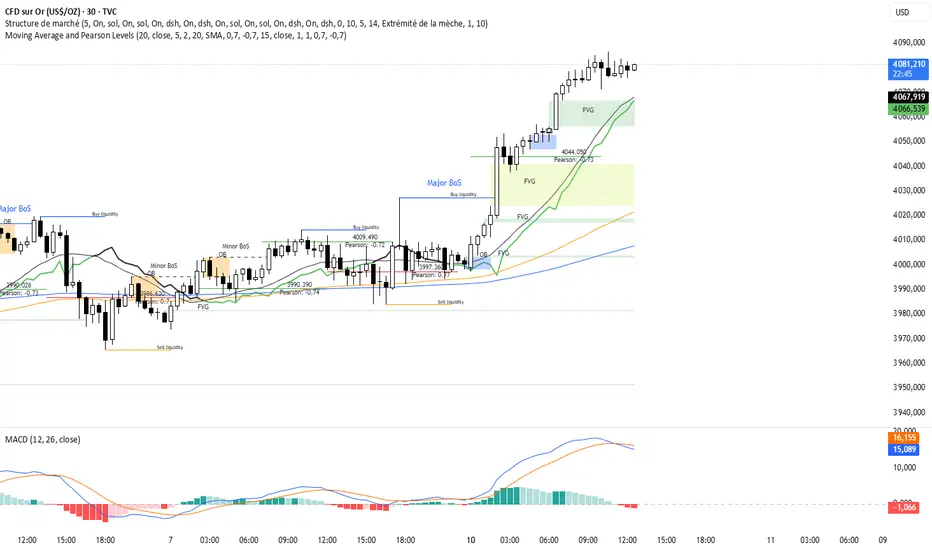
Moving Average and Pearson Levels Indicator
This Pine Script indicator combines a customizable moving average (MA) with Pearson correlation analysis to provide traders with deeper insights into trends and key reference levels. It overlays a Pearson-adjusted moving average on price charts and highlights levels based on correlation for potential trading opportunities. With flexible parameters, it adapts to various trading styles.
Key Features
Pearson-Adjusted Moving Average
Combines a basic MA (SMA, EMA, WMA, or VWMA) with a Pearson correlation adjustment to reflect trend strength.
Adjustable: MA length, price source, smoothing, and line thickness.
Optional color changes based on trends (positive/negative).
Pearson Correlation Levels
Plots smoothed Pearson correlation with upper/lower thresholds to signal strong or weak trends.
Marks entry levels with price labels and dynamic colors when thresholds are crossed.
Customizable: Pearson length, smoothing, thresholds, and colors.
Reference Levels and Alerts
Optional dotted lines for upper, lower, and zero correlation thresholds.
Alerts for bullish MA signals (crossing the lower threshold) and bearish signals (crossing below the upper threshold).
How It Works
Moving Average: Calculates a standard moving average enhanced by a Pearson adjustment based on price trends over a given period.
Pearson Levels: Computes the strength of correlation, smoothed for better readability, and plots price lines at threshold crossings.
Visualization: Displays the MA and levels with trend-reactive colors and optional reference lines.
Usage
Ideal for traders who combine traditional MAs with statistical trend analysis.
Adjust the MA type and Pearson length for short-term or long-term strategies.
Use correlation levels for reversal signals or trend confirmation.
Customization Options
MA Parameters: Select the type, length, and smoothing of the MA; toggle visibility and color changes.
Pearson Levels: Adjust thresholds, line thickness, and label colors.
Display Options: Show/hide reference lines and the standard MA for comparison purposes.
Example Settings
MA Length: 20
Type: EMA
Pearson Length: 15
Thresholds: 0.7/-0.7
Colors: Positive (black), Negative (green), Levels (gray)
Notes
Optimize based on your preferred timeframe.
Adjust smoothing to balance responsiveness and clarity.
Try it out, customize it to your needs, and enhance your trading setup! Feedback and suggestions are welcome.
リリースノート
Modification pour blocageオープンソーススクリプト
TradingViewの精神に則り、このスクリプトの作者はコードをオープンソースとして公開してくれました。トレーダーが内容を確認・検証できるようにという配慮です。作者に拍手を送りましょう!無料で利用できますが、コードの再公開はハウスルールに従う必要があります。
免責事項
この情報および投稿は、TradingViewが提供または推奨する金融、投資、トレード、その他のアドバイスや推奨を意図するものではなく、それらを構成するものでもありません。詳細は利用規約をご覧ください。
オープンソーススクリプト
TradingViewの精神に則り、このスクリプトの作者はコードをオープンソースとして公開してくれました。トレーダーが内容を確認・検証できるようにという配慮です。作者に拍手を送りましょう!無料で利用できますが、コードの再公開はハウスルールに従う必要があります。
免責事項
この情報および投稿は、TradingViewが提供または推奨する金融、投資、トレード、その他のアドバイスや推奨を意図するものではなく、それらを構成するものでもありません。詳細は利用規約をご覧ください。