OPEN-SOURCE SCRIPT
Upvol and Downvol
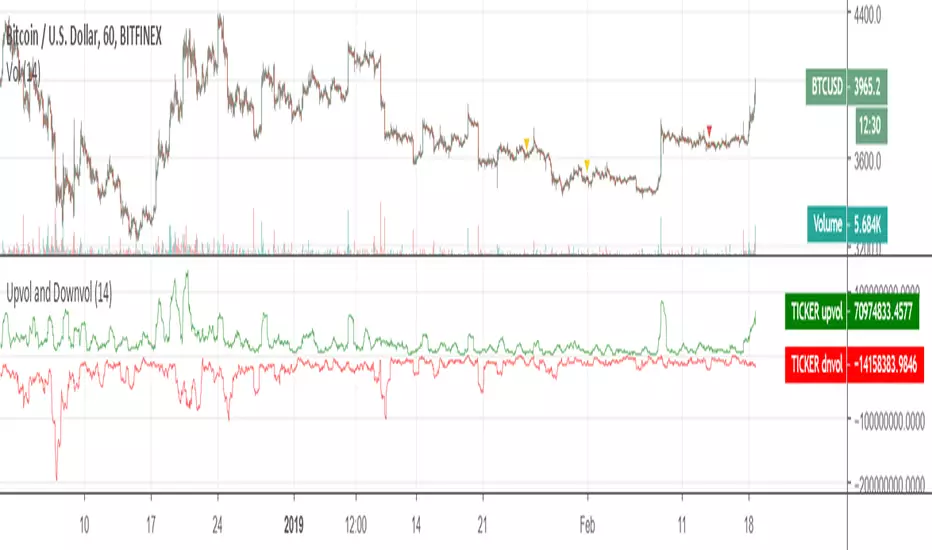
Upvolume and downvolume, calculated according to the MFI (Money Flow) formula, and shown separately.
The indicator has options for also showing NYSE upvolume and downvolume or ES1! (S&P500 upvolume/downvolume) along with the main ticker data, so you can compare them.
The chart can be analyzed by drawing trend lines, and can be surprisingly accurate.
~
The indicator has options for also showing NYSE upvolume and downvolume or ES1! (S&P500 upvolume/downvolume) along with the main ticker data, so you can compare them.
The chart can be analyzed by drawing trend lines, and can be surprisingly accurate.
~
オープンソーススクリプト
TradingViewの精神に則り、このスクリプトの作者はコードをオープンソースとして公開してくれました。トレーダーが内容を確認・検証できるようにという配慮です。作者に拍手を送りましょう!無料で利用できますが、コードの再公開はハウスルールに従う必要があります。
免責事項
この情報および投稿は、TradingViewが提供または推奨する金融、投資、トレード、その他のアドバイスや推奨を意図するものではなく、それらを構成するものでもありません。詳細は利用規約をご覧ください。
オープンソーススクリプト
TradingViewの精神に則り、このスクリプトの作者はコードをオープンソースとして公開してくれました。トレーダーが内容を確認・検証できるようにという配慮です。作者に拍手を送りましょう!無料で利用できますが、コードの再公開はハウスルールに従う必要があります。
免責事項
この情報および投稿は、TradingViewが提供または推奨する金融、投資、トレード、その他のアドバイスや推奨を意図するものではなく、それらを構成するものでもありません。詳細は利用規約をご覧ください。