PROTECTED SOURCE SCRIPT
Leonidas Volatility Oscillator
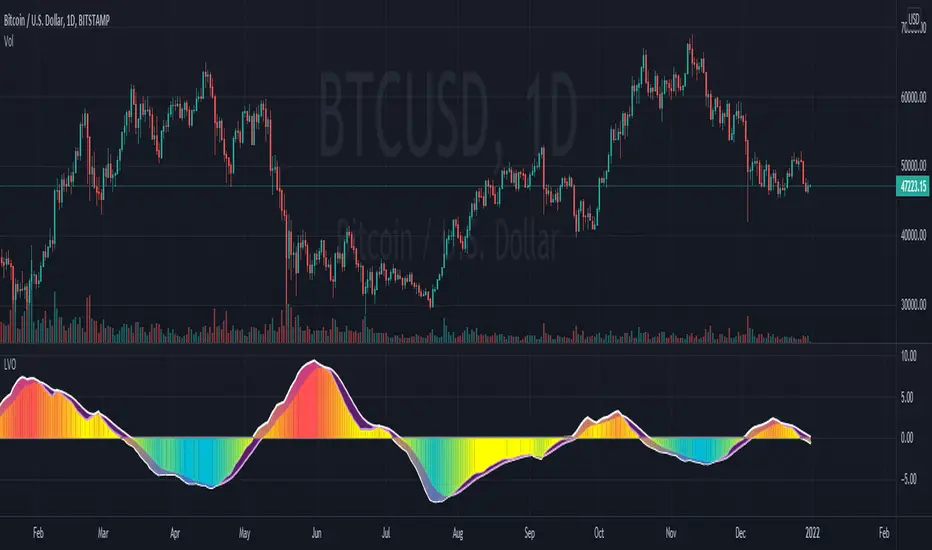
This indicator is showing the volatility based on ATR or Historical Volatility.
Volatility is one of the most powerful tools to catch explosive moves or identify when the market is in consolidation/distribution phase.
How to use this indicator:
Colors:
Blue Color is they most important color for this indicator .
This color is suggesting the volatility is reaching the lowest point the market is in consolidation/distribution phase. Depending of the time frame after this phase you will see an expansion.

Yellow/Red Color
Usually we will see this when the market is trending.

Trend.
This indicator is interesting because you will know if the volatility is trending powerful to keep your positions or ride the trend .

This indicator will not tell you when to sell or buy.
This indicator will help you to identify explosive moves, consolidation/distribution phases.
Volatility is one of the most powerful tools to catch explosive moves or identify when the market is in consolidation/distribution phase.
How to use this indicator:
Colors:
Blue Color is they most important color for this indicator .
This color is suggesting the volatility is reaching the lowest point the market is in consolidation/distribution phase. Depending of the time frame after this phase you will see an expansion.
Yellow/Red Color
Usually we will see this when the market is trending.
Trend.
This indicator is interesting because you will know if the volatility is trending powerful to keep your positions or ride the trend .
This indicator will not tell you when to sell or buy.
This indicator will help you to identify explosive moves, consolidation/distribution phases.
保護スクリプト
このスクリプトのソースコードは非公開で投稿されています。 ただし、制限なく自由に使用できます – 詳細はこちらでご確認ください。
Trading for living!
免責事項
この情報および投稿は、TradingViewが提供または推奨する金融、投資、トレード、その他のアドバイスや推奨を意図するものではなく、それらを構成するものでもありません。詳細は利用規約をご覧ください。
保護スクリプト
このスクリプトのソースコードは非公開で投稿されています。 ただし、制限なく自由に使用できます – 詳細はこちらでご確認ください。
Trading for living!
免責事項
この情報および投稿は、TradingViewが提供または推奨する金融、投資、トレード、その他のアドバイスや推奨を意図するものではなく、それらを構成するものでもありません。詳細は利用規約をご覧ください。