OPEN-SOURCE SCRIPT
B's Average RSI (5m-1D)
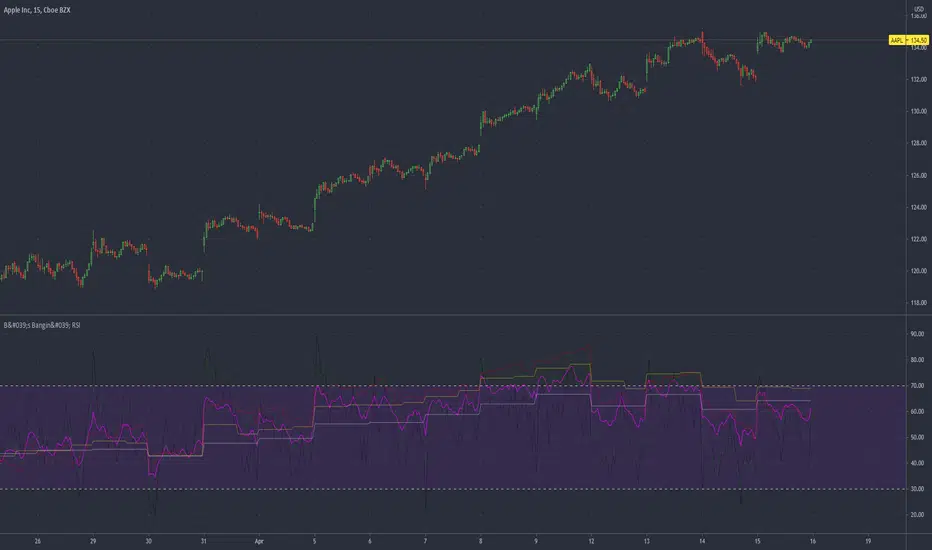
Multiple time frame RSIs plotted onto a single indicator.
Time frames used are:
5m (black)
15m (green)
60m (red)
240m (yellow)
Daily (white)
An average of all of the RSIs (pink)
RSI's are averaged into a single line. Also functions as multiple RSI's.
The pink average line should be used like any other RSI:
Above or below 50 signifies strength and weakness, respectively.
Above 80 and below 20 signal overbought and oversold conditions, respectively.
オープンソーススクリプト
TradingViewの精神に則り、この作者はスクリプトのソースコードを公開しているので、その内容を理解し検証することができます。作者に感謝です!無料でお使いいただけますが、このコードを投稿に再利用する際にはハウスルールに従うものとします。
免責事項
これらの情報および投稿は、TradingViewが提供または保証する金融、投資、取引、またはその他の種類のアドバイスや推奨を意図したものではなく、またそのようなものでもありません。詳しくは利用規約をご覧ください。
オープンソーススクリプト
TradingViewの精神に則り、この作者はスクリプトのソースコードを公開しているので、その内容を理解し検証することができます。作者に感謝です!無料でお使いいただけますが、このコードを投稿に再利用する際にはハウスルールに従うものとします。
免責事項
これらの情報および投稿は、TradingViewが提供または保証する金融、投資、取引、またはその他の種類のアドバイスや推奨を意図したものではなく、またそのようなものでもありません。詳しくは利用規約をご覧ください。