OPEN-SOURCE SCRIPT
Historical & Periodic Key Levels

Historical & Periodic Key Levels
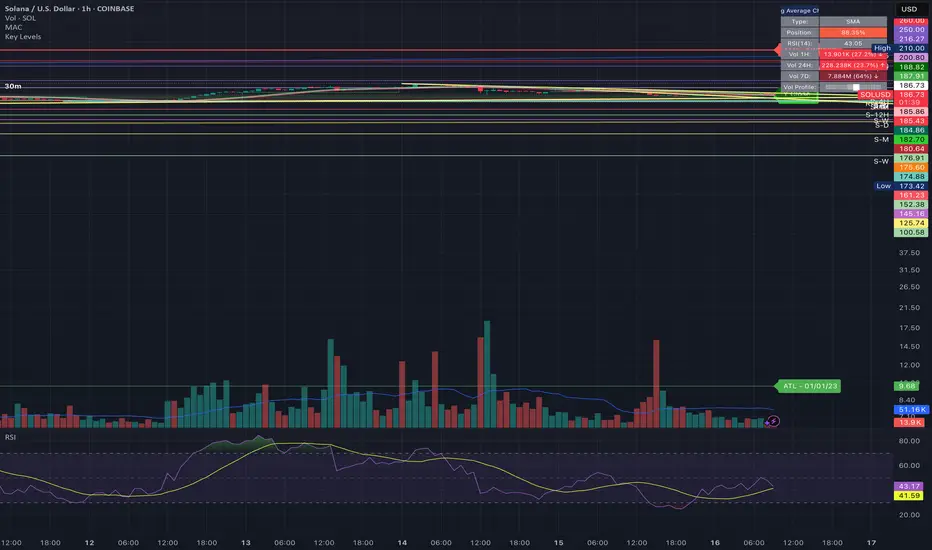
This indicator automatically plots historical key levels (ATH/ATL) and periodic closing levels (Daily, Weekly, Monthly, Yearly). It highlights major price zones frequently used in technical and institutional trading.
Key Features:
Usage:
Inputs:
Notes:
This indicator automatically plots historical key levels (ATH/ATL) and periodic closing levels (Daily, Weekly, Monthly, Yearly). It highlights major price zones frequently used in technical and institutional trading.
Key Features:
- Dynamic ATH/ATL: tracks all-time high/low with date annotation.
- Periodic Closes: previous D/W/M/Y closes with directional coloring.
- Adaptive Colors: green/red based on bullish or bearish close.
- Full Customization: toggle visibility, colors, line width, text alignment, and label text.
- Smart Label Management: prevents overlap by cycling through label styles automatically.
Usage:
- Identify strong support/resistance levels.
- Monitor key closing prices across multiple timeframes.
- Enhance swing trading and long-term analysis with institutional reference levels.
Inputs:
- Levels Visibility: show/hide ATH, ATL, and periodic closes.
- ATH/ATL Style Settings: line colors, label prefix, width, and text alignment.
- Periodic Levels Style: label text (D/W/M/Y), line width, alignment, and bullish/bearish colors.
Notes:
- Levels adjust automatically to the active chart timeframe.
- Lower timeframe levels are hidden when redundant (e.g., daily close on daily chart).
オープンソーススクリプト
TradingViewの精神に則り、このスクリプトの作者はコードをオープンソースとして公開してくれました。トレーダーが内容を確認・検証できるようにという配慮です。作者に拍手を送りましょう!無料で利用できますが、コードの再公開はハウスルールに従う必要があります。
免責事項
この情報および投稿は、TradingViewが提供または推奨する金融、投資、トレード、その他のアドバイスや推奨を意図するものではなく、それらを構成するものでもありません。詳細は利用規約をご覧ください。
オープンソーススクリプト
TradingViewの精神に則り、このスクリプトの作者はコードをオープンソースとして公開してくれました。トレーダーが内容を確認・検証できるようにという配慮です。作者に拍手を送りましょう!無料で利用できますが、コードの再公開はハウスルールに従う必要があります。
免責事項
この情報および投稿は、TradingViewが提供または推奨する金融、投資、トレード、その他のアドバイスや推奨を意図するものではなく、それらを構成するものでもありません。詳細は利用規約をご覧ください。