OPEN-SOURCE SCRIPT
VWAP Trend
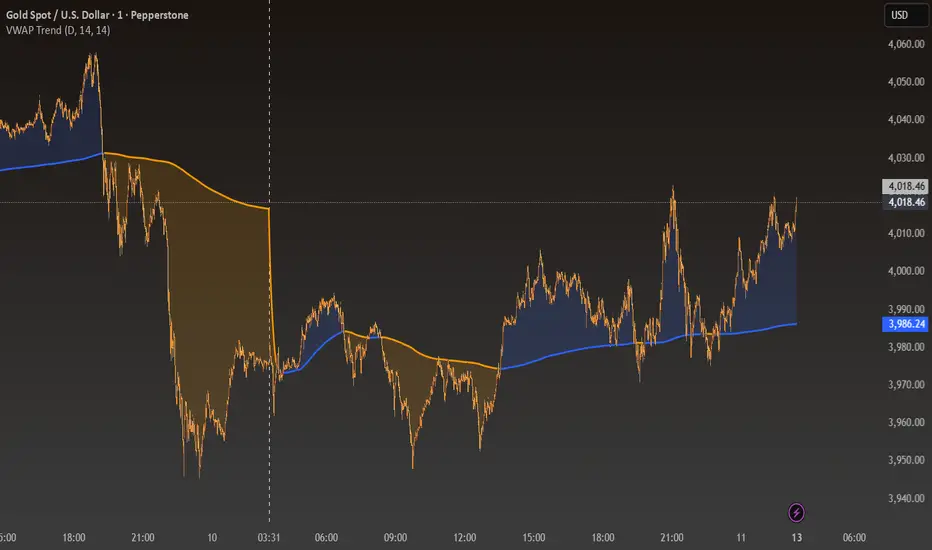
The VWAP Trend indicator is a powerful visualization tool that blends a smoothed Volume-Weighted Average Price (VWAP) with a trend-following EMA to reveal the underlying market bias in a clear, color-coded format.
Unlike a standard VWAP that only resets intraday, VWAP Trend allows traders to anchor VWAP calculations to Daily, Weekly, or Monthly sessions. This flexibility makes it suitable for all trading styles — from intraday scalping to long-term swing analysis.
The smoothed VWAP provides a stable representation of the true average price weighted by volume, while the EMA reflects the prevailing market trend. When the EMA remains above the VWAP, the indicator highlights bullish conditions with blue tones. When it moves below, bearish momentum is displayed with orange tones.
Features
Adjustable VWAP anchor timeframe (Daily, Weekly, or Monthly)
Smoothed VWAP for reduced noise and improved accuracy
Dynamic EMA overlay for real-time trend detection
Color-coded shading between price and VWAP
Minimalist design ideal for clean chart analysis
How to Use
Select your preferred VWAP anchor timeframe.
Observe how the shading color shifts between blue (bullish) and orange (bearish).
Use these transitions to gauge market bias, confirm trade setups, or identify potential mean reversion zones.
オープンソーススクリプト
TradingViewの精神に則り、この作者はスクリプトのソースコードを公開しているので、その内容を理解し検証することができます。作者に感謝です!無料でお使いいただけますが、このコードを投稿に再利用する際にはハウスルールに従うものとします。
免責事項
これらの情報および投稿は、TradingViewが提供または保証する金融、投資、取引、またはその他の種類のアドバイスや推奨を意図したものではなく、またそのようなものでもありません。詳しくは利用規約をご覧ください。
オープンソーススクリプト
TradingViewの精神に則り、この作者はスクリプトのソースコードを公開しているので、その内容を理解し検証することができます。作者に感謝です!無料でお使いいただけますが、このコードを投稿に再利用する際にはハウスルールに従うものとします。
免責事項
これらの情報および投稿は、TradingViewが提供または保証する金融、投資、取引、またはその他の種類のアドバイスや推奨を意図したものではなく、またそのようなものでもありません。詳しくは利用規約をご覧ください。