OPEN-SOURCE SCRIPT
Weekly High/Low Day Stats
This TradingView Pine Script (v5) analyzes weekly highs and lows to identify on which day of the week (Monday → Friday) they most frequently occur.
🔎 How it works:
Tracks the weekly highest high and lowest low.
At the end of each week, it records the day of the week when the high and low were set.
Keeps historical data for the last 100 weeks (adjustable).
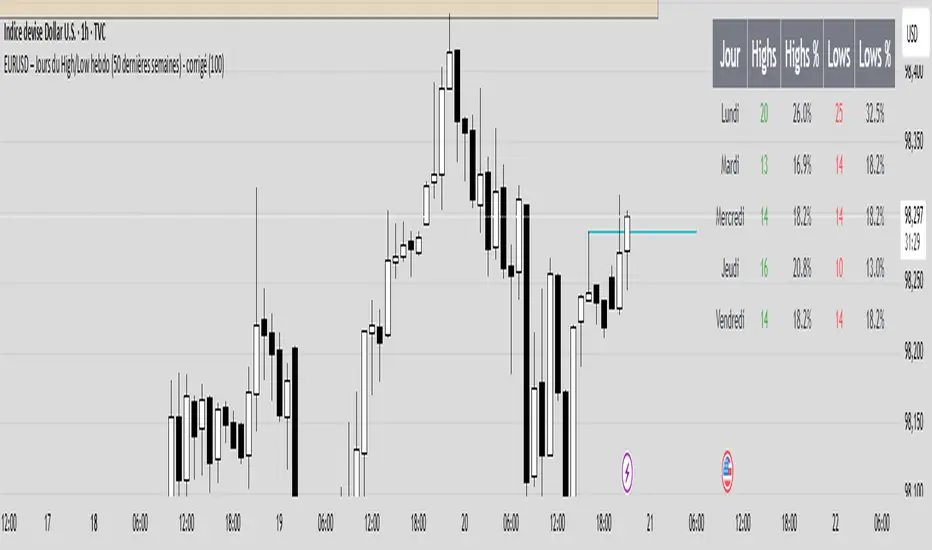
Displays a table showing:
How many times each day marked the weekly high or weekly low.
The corresponding percentage distribution.
🎯 Use case:
Helps traders understand the weekly timing tendency
Reveals which day is statistically more likely to set the weekly high or weekly low.
Useful for weekly planning and strategies that rely on market structure and timing (e.g., ICT concepts like the "High/Low of the Week").
🔎 How it works:
Tracks the weekly highest high and lowest low.
At the end of each week, it records the day of the week when the high and low were set.
Keeps historical data for the last 100 weeks (adjustable).
Displays a table showing:
How many times each day marked the weekly high or weekly low.
The corresponding percentage distribution.
🎯 Use case:
Helps traders understand the weekly timing tendency
Reveals which day is statistically more likely to set the weekly high or weekly low.
Useful for weekly planning and strategies that rely on market structure and timing (e.g., ICT concepts like the "High/Low of the Week").
オープンソーススクリプト
TradingViewの精神に則り、この作者はスクリプトのソースコードを公開しているので、その内容を理解し検証することができます。作者に感謝です!無料でお使いいただけますが、このコードを投稿に再利用する際にはハウスルールに従うものとします。
免責事項
これらの情報および投稿は、TradingViewが提供または保証する金融、投資、取引、またはその他の種類のアドバイスや推奨を意図したものではなく、またそのようなものでもありません。詳しくは利用規約をご覧ください。
オープンソーススクリプト
TradingViewの精神に則り、この作者はスクリプトのソースコードを公開しているので、その内容を理解し検証することができます。作者に感謝です!無料でお使いいただけますが、このコードを投稿に再利用する際にはハウスルールに従うものとします。
免責事項
これらの情報および投稿は、TradingViewが提供または保証する金融、投資、取引、またはその他の種類のアドバイスや推奨を意図したものではなく、またそのようなものでもありません。詳しくは利用規約をご覧ください。