OPEN-SOURCE SCRIPT
Democratic Fibonacci Moving Averages
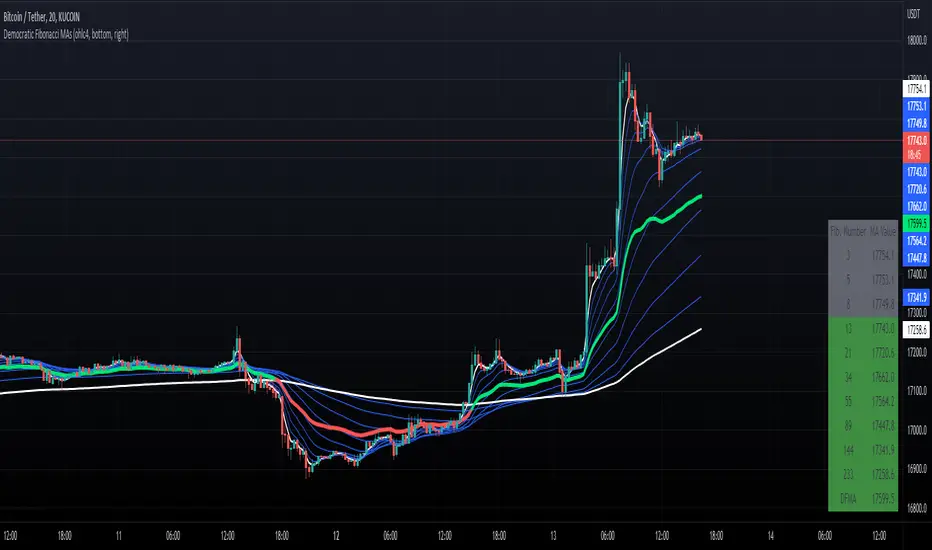
With this indicator, we have taken moving averages at Fibonacci lengths (3 to 233) as well as the average of these values, labeled the DFMA. Additionally, these values have been inputted into a table overlay. The cross of the FibMA(233) and the DFMA can be used as a signal for long or short.
The FibMA lengths of 3 and 233 are plotted in white by default, the FibMAs with lengths between 3 and 233 are plotted in blue by default, and the democratic line (DFMA) that averages these lines is plotted in green or red (depending on if the value is above or below the 233-length FibMA).
The FibMA lengths of 3 and 233 are plotted in white by default, the FibMAs with lengths between 3 and 233 are plotted in blue by default, and the democratic line (DFMA) that averages these lines is plotted in green or red (depending on if the value is above or below the 233-length FibMA).
オープンソーススクリプト
TradingViewの精神に則り、このスクリプトの作者はコードをオープンソースとして公開してくれました。トレーダーが内容を確認・検証できるようにという配慮です。作者に拍手を送りましょう!無料で利用できますが、コードの再公開はハウスルールに従う必要があります。
免責事項
この情報および投稿は、TradingViewが提供または推奨する金融、投資、トレード、その他のアドバイスや推奨を意図するものではなく、それらを構成するものでもありません。詳細は利用規約をご覧ください。
オープンソーススクリプト
TradingViewの精神に則り、このスクリプトの作者はコードをオープンソースとして公開してくれました。トレーダーが内容を確認・検証できるようにという配慮です。作者に拍手を送りましょう!無料で利用できますが、コードの再公開はハウスルールに従う必要があります。
免責事項
この情報および投稿は、TradingViewが提供または推奨する金融、投資、トレード、その他のアドバイスや推奨を意図するものではなく、それらを構成するものでもありません。詳細は利用規約をご覧ください。