OPEN-SOURCE SCRIPT
更新済 Trend Sentiment [racer8]
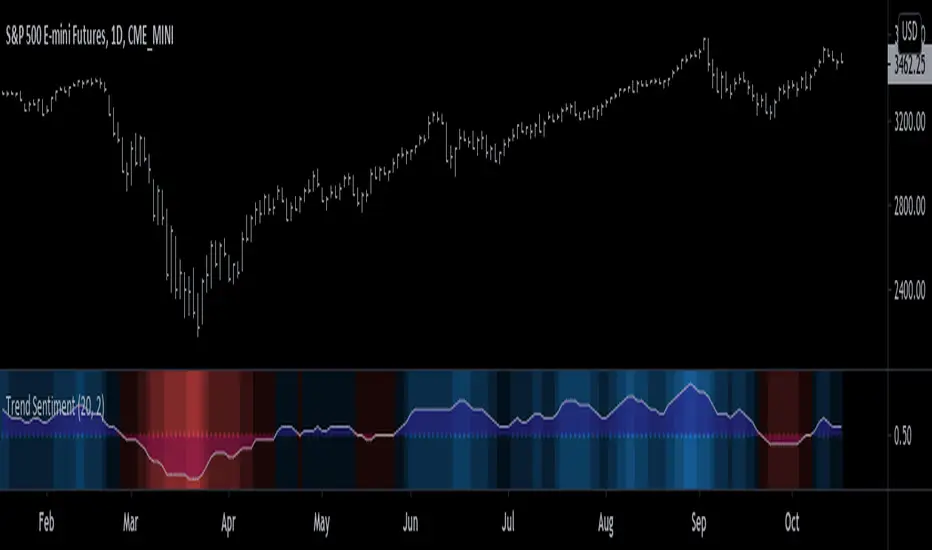
Trend Sentiment is a trend indicator with enhanced graphics, that is, it has many different shades of blue and red.
The brighter the blue, the more bullish.
The brighter the red, the more bearish.
It is a simple indicator with a basic formula:
a = close > prev.close? ---> If yes, a = 1, otherwise a = 0.
b = sma of a over n periods -----1st parameter, n...."Length"
c = sma of b over j periods ----- 2nd parmeter, j..."Smoothing"
plot (c)
Is c > 0.5? ---> If yes, background color = blue, otherwise red.
plot background color.
plot 0.5 as dotted midline.
The Trend Sentiment value represents the percentage of bullish force in the market.
Signals are generated when it crosses the 50% mark.
Values above 0.50 are bullish and values below 0.50 are bearish.
Enjoy and hit the like button :)
リリースノート
Added area fill color.オープンソーススクリプト
TradingViewの精神に則り、このスクリプトの作者はコードをオープンソースとして公開してくれました。トレーダーが内容を確認・検証できるようにという配慮です。作者に拍手を送りましょう!無料で利用できますが、コードの再公開はハウスルールに従う必要があります。
免責事項
この情報および投稿は、TradingViewが提供または推奨する金融、投資、トレード、その他のアドバイスや推奨を意図するものではなく、それらを構成するものでもありません。詳細は利用規約をご覧ください。
オープンソーススクリプト
TradingViewの精神に則り、このスクリプトの作者はコードをオープンソースとして公開してくれました。トレーダーが内容を確認・検証できるようにという配慮です。作者に拍手を送りましょう!無料で利用できますが、コードの再公開はハウスルールに従う必要があります。
免責事項
この情報および投稿は、TradingViewが提供または推奨する金融、投資、トレード、その他のアドバイスや推奨を意図するものではなく、それらを構成するものでもありません。詳細は利用規約をご覧ください。