OPEN-SOURCE SCRIPT
更新済 VOLatiliUM
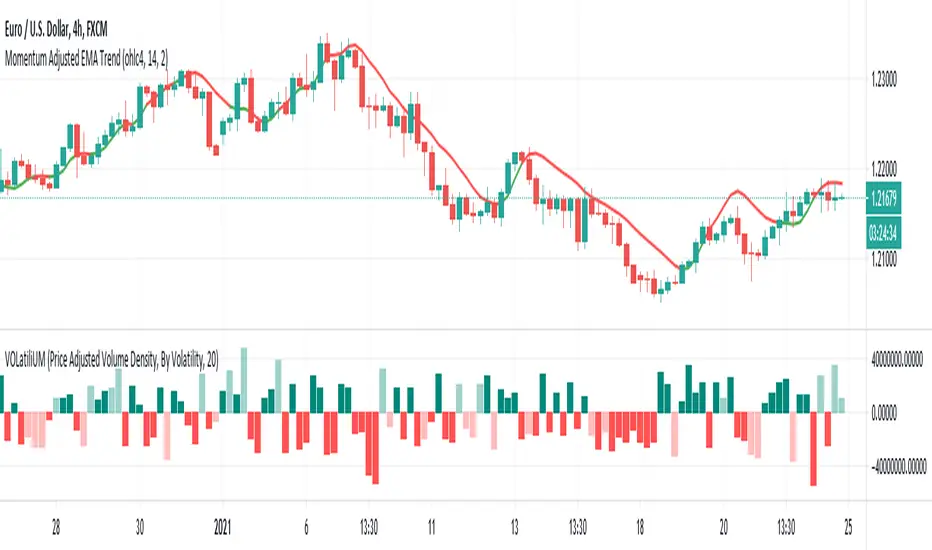
This is a useful conjunction of volume and volatility together in one script, so I named it a blended name!
It can show the diagram of:
- Volume
- Volume Variation (Volume - Past Volume)
- Volume Density (Volume / (High - Low))
- Volatility in combination with the aforesaid ones
It also offers two concepts of bar colorizing, by using the size of the bars or by applying volatility from a higher time frame (HTF).
The option "Absolute Bar Values" is included for the ones who like to see all bars positive above the zero line!
Feel free to use the script and send me your opinions. Thanks.
リリースノート
- Fixed some bugs- Added some colorization modes
オープンソーススクリプト
TradingViewの精神に則り、このスクリプトの作者はコードをオープンソースとして公開してくれました。トレーダーが内容を確認・検証できるようにという配慮です。作者に拍手を送りましょう!無料で利用できますが、コードの再公開はハウスルールに従う必要があります。
免責事項
この情報および投稿は、TradingViewが提供または推奨する金融、投資、トレード、その他のアドバイスや推奨を意図するものではなく、それらを構成するものでもありません。詳細は利用規約をご覧ください。
オープンソーススクリプト
TradingViewの精神に則り、このスクリプトの作者はコードをオープンソースとして公開してくれました。トレーダーが内容を確認・検証できるようにという配慮です。作者に拍手を送りましょう!無料で利用できますが、コードの再公開はハウスルールに従う必要があります。
免責事項
この情報および投稿は、TradingViewが提供または推奨する金融、投資、トレード、その他のアドバイスや推奨を意図するものではなく、それらを構成するものでもありません。詳細は利用規約をご覧ください。