OPEN-SOURCE SCRIPT
Multi-Signal Indikator
Hier ist eine professionelle Beschreibung für deinen Indikator auf Englisch:
Multi-Signal Trading Indicator - Complete Market Analysis
This comprehensive trading indicator combines multiple technical analysis tools into one powerful dashboard, providing traders with all essential market information at a glance.
Key Features:
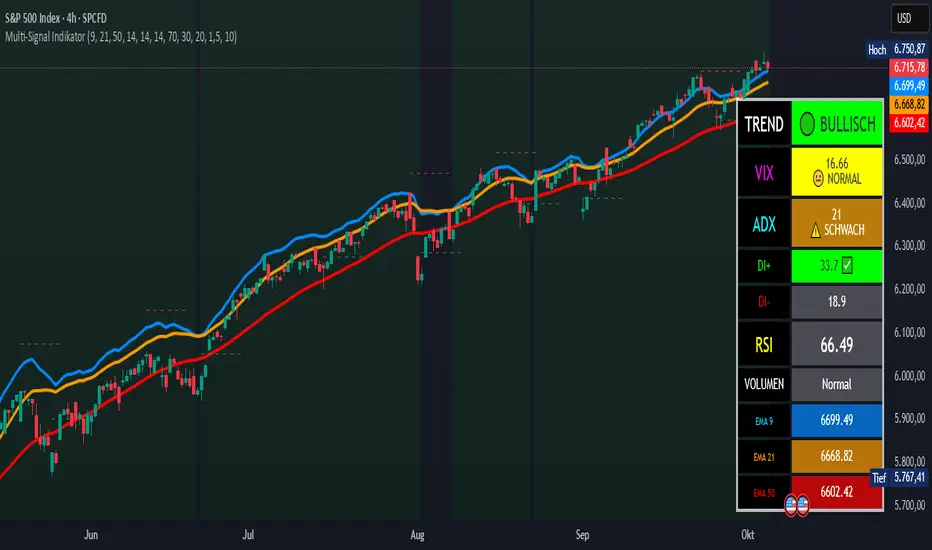
Trend Analysis: Three EMAs (9, 21, 50) with automatic trend detection and Golden/Death Cross signals
Momentum Indicators: RSI with overbought/oversold zones and visual alerts
Trend Strength: ADX indicator with DI+ and DI- showing the power of bullish and bearish movements
Market Fear Gauge: VIX (Volatility Index) integration displaying market sentiment from calm to panic levels
Volume Confirmation: Smart volume analysis comparing current activity against 20-period average
Support & Resistance: Automatic pivot point detection with dynamic S/R lines
Buy/Sell Signals: Combined signals only trigger when trend, RSI, and volume align perfectly
Visual Dashboard: Color-coded info panel showing all metrics in real-time with intuitive emoji indicators
Perfect for: Day traders, swing traders, and investors who want a complete market overview without cluttering their charts with multiple indicators.
Customizable settings allow you to adjust all parameters to match your trading style.
Multi-Signal Trading Indicator - Complete Market Analysis
This comprehensive trading indicator combines multiple technical analysis tools into one powerful dashboard, providing traders with all essential market information at a glance.
Key Features:
Trend Analysis: Three EMAs (9, 21, 50) with automatic trend detection and Golden/Death Cross signals
Momentum Indicators: RSI with overbought/oversold zones and visual alerts
Trend Strength: ADX indicator with DI+ and DI- showing the power of bullish and bearish movements
Market Fear Gauge: VIX (Volatility Index) integration displaying market sentiment from calm to panic levels
Volume Confirmation: Smart volume analysis comparing current activity against 20-period average
Support & Resistance: Automatic pivot point detection with dynamic S/R lines
Buy/Sell Signals: Combined signals only trigger when trend, RSI, and volume align perfectly
Visual Dashboard: Color-coded info panel showing all metrics in real-time with intuitive emoji indicators
Perfect for: Day traders, swing traders, and investors who want a complete market overview without cluttering their charts with multiple indicators.
Customizable settings allow you to adjust all parameters to match your trading style.
オープンソーススクリプト
TradingViewの精神に則り、このスクリプトの作者はコードをオープンソースとして公開してくれました。トレーダーが内容を確認・検証できるようにという配慮です。作者に拍手を送りましょう!無料で利用できますが、コードの再公開はハウスルールに従う必要があります。
免責事項
この情報および投稿は、TradingViewが提供または推奨する金融、投資、トレード、その他のアドバイスや推奨を意図するものではなく、それらを構成するものでもありません。詳細は利用規約をご覧ください。
オープンソーススクリプト
TradingViewの精神に則り、このスクリプトの作者はコードをオープンソースとして公開してくれました。トレーダーが内容を確認・検証できるようにという配慮です。作者に拍手を送りましょう!無料で利用できますが、コードの再公開はハウスルールに従う必要があります。
免責事項
この情報および投稿は、TradingViewが提供または推奨する金融、投資、トレード、その他のアドバイスや推奨を意図するものではなく、それらを構成するものでもありません。詳細は利用規約をご覧ください。