OPEN-SOURCE SCRIPT
Multiple MA (techsound088)

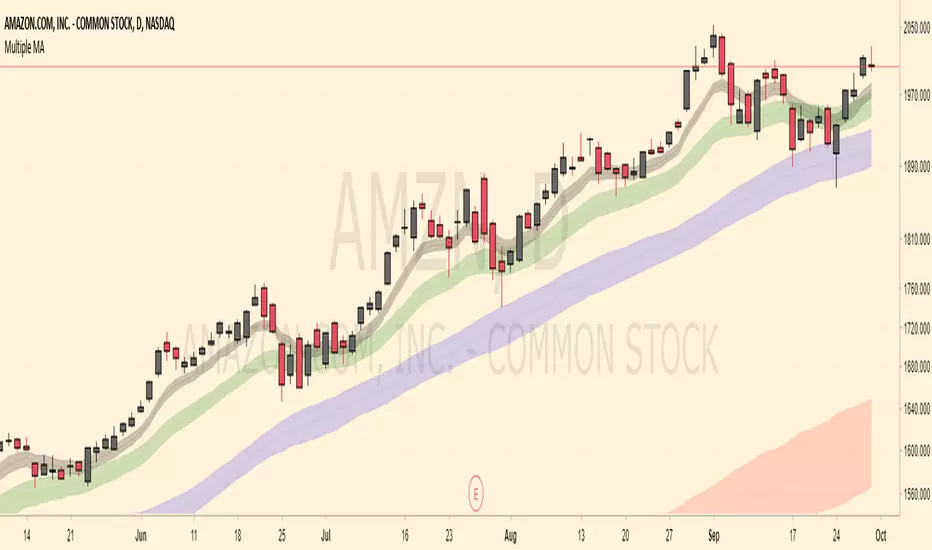
Common moving addresses often act as support and resistance levels. This script will incorporate four (2 exponential and 2 simple ) moving averages. The default are lengths of 8, 20, 50, and 200. These are adjustable. Many of us are aware that these areas often tend to be supply / demands zones. We are also aware that movement around these areas can fluctuate greatly so I've included ATR-based bands around the moving averages hoping to visualize these moving averages in a less rigid and more realistic way. Feel free to modify this script as you please. Constructive feedback is always appreciated.
オープンソーススクリプト
TradingViewの精神に則り、このスクリプトの作者はコードをオープンソースとして公開してくれました。トレーダーが内容を確認・検証できるようにという配慮です。作者に拍手を送りましょう!無料で利用できますが、コードの再公開はハウスルールに従う必要があります。
免責事項
この情報および投稿は、TradingViewが提供または推奨する金融、投資、トレード、その他のアドバイスや推奨を意図するものではなく、それらを構成するものでもありません。詳細は利用規約をご覧ください。
オープンソーススクリプト
TradingViewの精神に則り、このスクリプトの作者はコードをオープンソースとして公開してくれました。トレーダーが内容を確認・検証できるようにという配慮です。作者に拍手を送りましょう!無料で利用できますが、コードの再公開はハウスルールに従う必要があります。
免責事項
この情報および投稿は、TradingViewが提供または推奨する金融、投資、トレード、その他のアドバイスや推奨を意図するものではなく、それらを構成するものでもありません。詳細は利用規約をご覧ください。