OPEN-SOURCE SCRIPT
更新済 Custom Level Indicator
This indicator is mainly used for back testing your strategy manually. It allows you to set a fixed target value and SL value to see if your strategy hits the target or it hits the SL.
Input the entry value.
It will allow you to input a fixed target value and SL value for both bullish and bearish trades. The Bullish trades are indicated by Green and Bearish trades are indicated by Red lines.
Input the entry value.
It will allow you to input a fixed target value and SL value for both bullish and bearish trades. The Bullish trades are indicated by Green and Bearish trades are indicated by Red lines.
リリースノート
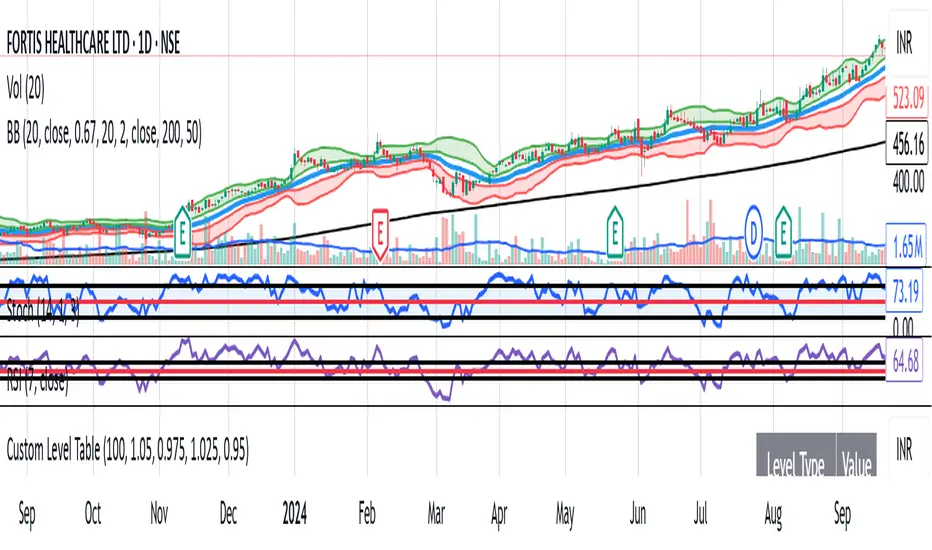
This script is used to back test your strategy manually.You can enter a value and you will get 4 level drawn on the chart.
Green lines are for Target and SL for Bullish trades. Red lines are for Target and SL for Bearish trades. You can choose the Target and SL percentages to suit your trading style.
リリースノート
Updated the code to debugリリースノート
Instead of lines drawn on the chart, the values will be displayed as a table on the top right part of the chartオープンソーススクリプト
TradingViewの精神に則り、このスクリプトの作者はコードをオープンソースとして公開してくれました。トレーダーが内容を確認・検証できるようにという配慮です。作者に拍手を送りましょう!無料で利用できますが、コードの再公開はハウスルールに従う必要があります。
免責事項
この情報および投稿は、TradingViewが提供または推奨する金融、投資、トレード、その他のアドバイスや推奨を意図するものではなく、それらを構成するものでもありません。詳細は利用規約をご覧ください。
オープンソーススクリプト
TradingViewの精神に則り、このスクリプトの作者はコードをオープンソースとして公開してくれました。トレーダーが内容を確認・検証できるようにという配慮です。作者に拍手を送りましょう!無料で利用できますが、コードの再公開はハウスルールに従う必要があります。
免責事項
この情報および投稿は、TradingViewが提供または推奨する金融、投資、トレード、その他のアドバイスや推奨を意図するものではなく、それらを構成するものでもありません。詳細は利用規約をご覧ください。