OPEN-SOURCE SCRIPT
4 Bar Fractal
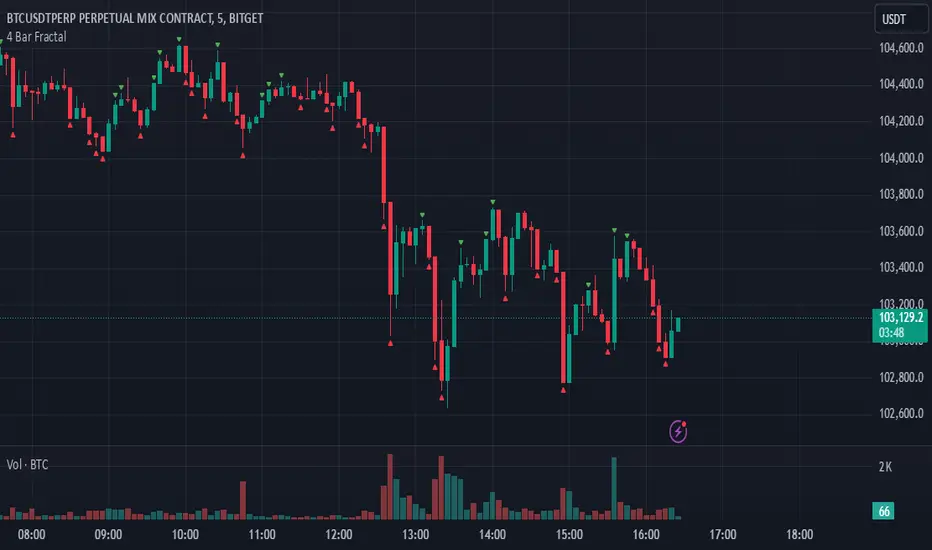
This indicator is a simple yet powerful tool that tracks potential trend reversals by checking whether the closing price of the last candle in a four-candle sequence finishes above or below the highs or lows of both the immediately preceding candle and the first candle in that sequence. If the closing price breaks above those prior highs, a green triangle appears above the chart to indicate bullish momentum; if it breaks below those lows, a red triangle appears below the chart to signal bearish momentum. Not only is it beneficial for scalping or other short-term trading, but it also works well for swing trades and longer-term trends, making it one of the most effective indicators for catching significant market shifts. However, to avoid false breakouts, it is advisable to confirm signals with volume or additional trend indicators and to maintain disciplined risk management.
オープンソーススクリプト
TradingViewの精神に則り、このスクリプトの作者はコードをオープンソースとして公開してくれました。トレーダーが内容を確認・検証できるようにという配慮です。作者に拍手を送りましょう!無料で利用できますが、コードの再公開はハウスルールに従う必要があります。
免責事項
この情報および投稿は、TradingViewが提供または推奨する金融、投資、トレード、その他のアドバイスや推奨を意図するものではなく、それらを構成するものでもありません。詳細は利用規約をご覧ください。
オープンソーススクリプト
TradingViewの精神に則り、このスクリプトの作者はコードをオープンソースとして公開してくれました。トレーダーが内容を確認・検証できるようにという配慮です。作者に拍手を送りましょう!無料で利用できますが、コードの再公開はハウスルールに従う必要があります。
免責事項
この情報および投稿は、TradingViewが提供または推奨する金融、投資、トレード、その他のアドバイスや推奨を意図するものではなく、それらを構成するものでもありません。詳細は利用規約をご覧ください。