OPEN-SOURCE SCRIPT
Range over Volume
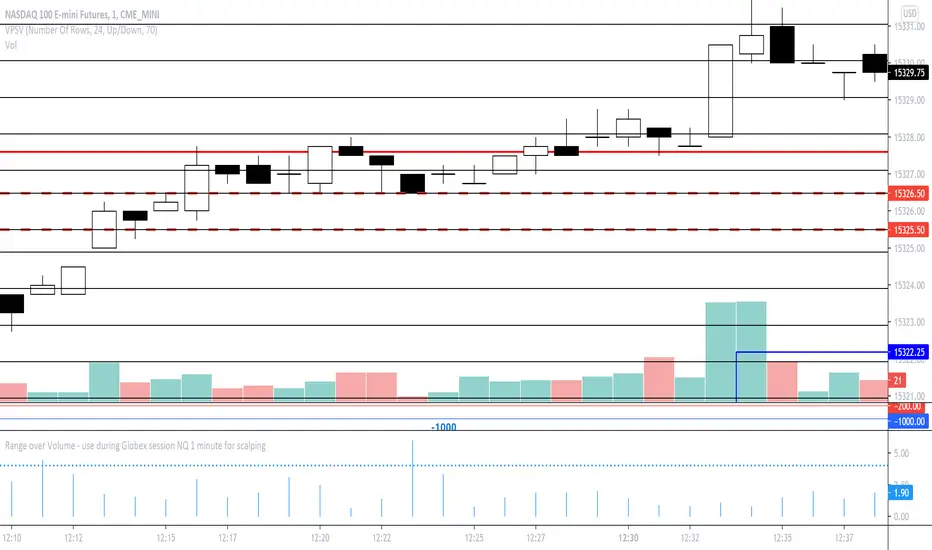
This is a scalping aid for NQ in the 1 minute time range for the Globex session.
Mathematically, the plot is range in ticks divided by 0.1*volume
This returns a histogram plot for RoV (range over volume)
The idea is that candles that ascribe a larger range with minimal volume does because there is unilateral aggression from the buy side, or sell side, and the subsequent behavioural outcome of this will either be an extension of that aggression unilaterally, or commonly, a counter to that aggression!
Wait for a candle to close with the RoV above 4.00. For that candle which formed the RoV above 4.00, plot the highs and lows of that candle and draw a 1.618x and -0.618x Fibonacci extension across it.
Enter short on the -0.618x and take profits at the -1.618x. Use the low of the ROV > 4 candle as a protective stop
Enter long on the 1.618 and take profits at 2.618. Use the high of the ROV > 4 candle as a protective stop
オープンソーススクリプト
TradingViewの精神に則り、このスクリプトの作者はコードをオープンソースとして公開してくれました。トレーダーが内容を確認・検証できるようにという配慮です。作者に拍手を送りましょう!無料で利用できますが、コードの再公開はハウスルールに従う必要があります。
免責事項
この情報および投稿は、TradingViewが提供または推奨する金融、投資、トレード、その他のアドバイスや推奨を意図するものではなく、それらを構成するものでもありません。詳細は利用規約をご覧ください。
オープンソーススクリプト
TradingViewの精神に則り、このスクリプトの作者はコードをオープンソースとして公開してくれました。トレーダーが内容を確認・検証できるようにという配慮です。作者に拍手を送りましょう!無料で利用できますが、コードの再公開はハウスルールに従う必要があります。
免責事項
この情報および投稿は、TradingViewが提供または推奨する金融、投資、トレード、その他のアドバイスや推奨を意図するものではなく、それらを構成するものでもありません。詳細は利用規約をご覧ください。