PINE LIBRARY
更新済 CommonMarkup
Library "CommonMarkup"
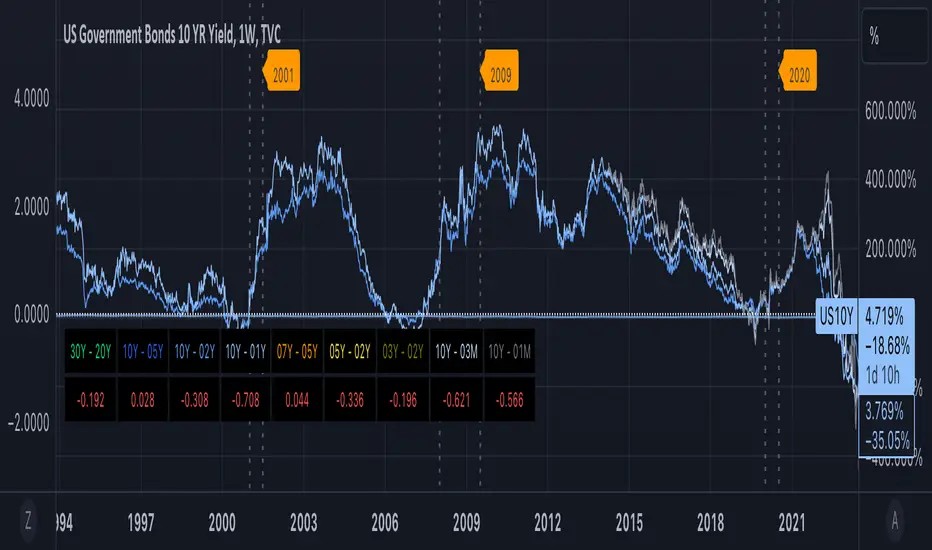
Provides functions for chart markup, such as indicating recession bands.
markRecessionBands(showBands, lineY, labelY)
Mark vertical bands and show recession band labels if argument showBands is true. Example "markRecessionBands(bar_index[0],3.0"
Parameters:
showBands: - show vertical recession bands when true. Functionally equiv to no op when false
lineY: - y-axis value for line positioning
labelY: - y-axis value for label positioning
return true - always answers the value of showBands
リリースノート
Common markup lib v2. Changes as follows:- Added 2022 contraction over Q1 to Q2
- Updated time refs to be UTC+0
リリースノート
Minor cosmetic rendering updatesリリースノート
v4 - minor display and formatting updates for readabilityリリースノート
v5Added control parameter for defining if 2 consecutive quarters of negative GDP is considered a recession
Updated:
markRecessionBands(showBands, twoQrtsOfNegativeGDPIsRecession, lineY, labelY)
Mark vertical bands and show recession band labels if argument showBands is true. Example "markRecessionBands(bar_index[0],3.0"
Parameters:
showBands: - show vertical recession bands when true. Functionally equiv to no op when false
twoQrtsOfNegativeGDPIsRecession: - if true, then periods with two consecutive quarters of negative GDP is considered a recession. Defaut is false.
lineY: - y-axis value for line positioning
labelY: - y-axis value for label positioning
return true - always answers the value of showBands
リリースノート
v6Updated:
markRecessionBands(showBands, twoQrtsOfNegativeGDPIsRecession, labelY)
Mark vertical bands and show recession band labels if argument showBands is true. Example "markRecessionBands(bar_index[0],false3.0)"
Parameters:
showBands (bool): - show vertical recession bands when true. Functionally equiv to no op when false
twoQrtsOfNegativeGDPIsRecession (bool): - if true, then periods with two consecutive quarters of negative GDP are considered a recession. Defaut is false.
labelY (float): - y-axis value for label positioning
return true - always answers the value of showBands
リリースノート
v7Updated:
- Resolved issue with private function for drawing recession bands scaling the y-axis excessively
Pineライブラリ
TradingViewの精神に則り、作者はこのPineコードをオープンソースライブラリとして公開してくれました。コミュニティの他のPineプログラマーが再利用できるようにという配慮です。作者に拍手を!このライブラリは個人利用や他のオープンソースの公開コンテンツで使用できますが、公開物でのコードの再利用はハウスルールに準じる必要があります。
免責事項
この情報および投稿は、TradingViewが提供または推奨する金融、投資、トレード、その他のアドバイスや推奨を意図するものではなく、それらを構成するものでもありません。詳細は利用規約をご覧ください。
Pineライブラリ
TradingViewの精神に則り、作者はこのPineコードをオープンソースライブラリとして公開してくれました。コミュニティの他のPineプログラマーが再利用できるようにという配慮です。作者に拍手を!このライブラリは個人利用や他のオープンソースの公開コンテンツで使用できますが、公開物でのコードの再利用はハウスルールに準じる必要があります。
免責事項
この情報および投稿は、TradingViewが提供または推奨する金融、投資、トレード、その他のアドバイスや推奨を意図するものではなく、それらを構成するものでもありません。詳細は利用規約をご覧ください。