OPEN-SOURCE SCRIPT
更新済 Average Daily Liquidity
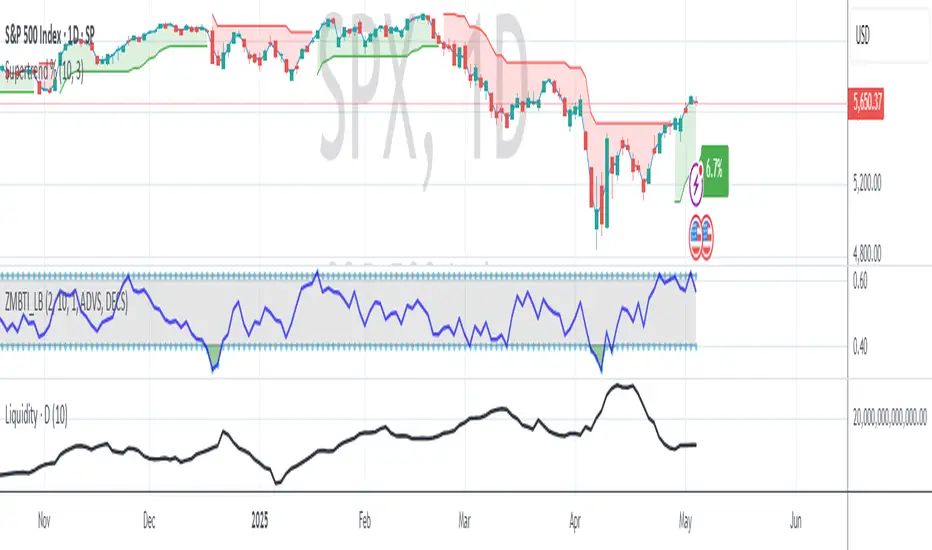
It is important to have sufficient daily trading value (liquidity) to ensure you can easily enter and, importantly, exit the trade. This indicator allows you to see if the traded value of a stock is adequate. The default average is 10 periods and it is common to average the daily traded value as both price and volume can have spikes causing trading errors. Some investors use a 5 period for a week, 10 period for 2 weeks, 20 or 21 period for 4 weeks/month and 65 periods for a quarter. You need to ascertain your buying amount such as $10000 and then have the average daily trading value be your comfortable moving average more such as average liquidity is more than 10 x MA(close x volume) or $100000 in this example. The value is extremely important for small and micro cap stocks you may wish to purchase.
リリースノート
Corrected script to correctly show the required average daily liquidity. Added a tooltip.オープンソーススクリプト
TradingViewの精神に則り、このスクリプトの作者はコードをオープンソースとして公開してくれました。トレーダーが内容を確認・検証できるようにという配慮です。作者に拍手を送りましょう!無料で利用できますが、コードの再公開はハウスルールに従う必要があります。
免責事項
この情報および投稿は、TradingViewが提供または推奨する金融、投資、トレード、その他のアドバイスや推奨を意図するものではなく、それらを構成するものでもありません。詳細は利用規約をご覧ください。
オープンソーススクリプト
TradingViewの精神に則り、このスクリプトの作者はコードをオープンソースとして公開してくれました。トレーダーが内容を確認・検証できるようにという配慮です。作者に拍手を送りましょう!無料で利用できますが、コードの再公開はハウスルールに従う必要があります。
免責事項
この情報および投稿は、TradingViewが提供または推奨する金融、投資、トレード、その他のアドバイスや推奨を意図するものではなく、それらを構成するものでもありません。詳細は利用規約をご覧ください。