OPEN-SOURCE SCRIPT
Quant Trend + Donchian (Educational, Public-Safe)

What this does
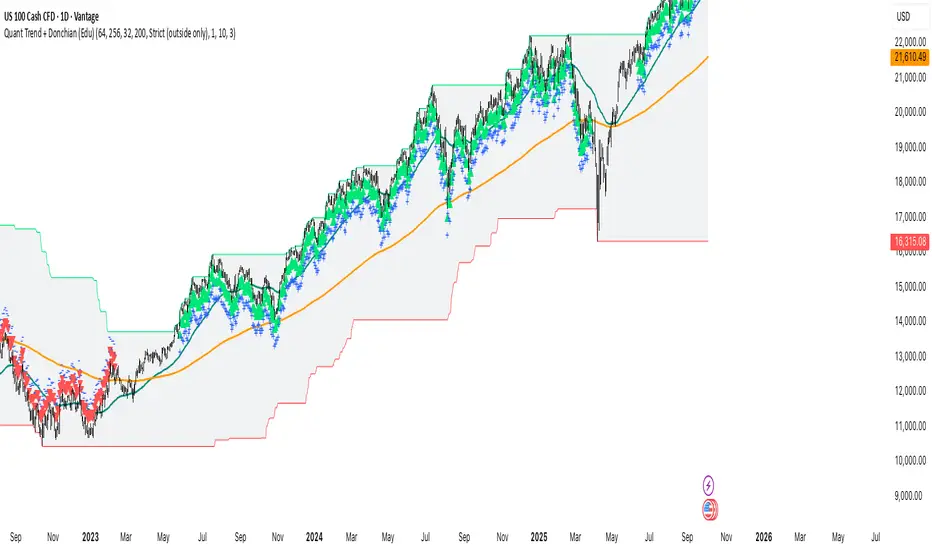
Educational, public-safe visualization of a quant regime model:
• Trend: EMA(64) vs EMA(256) (EWMAC proxy)
• Breakout: Donchian channel (200)
• Volatility-awareness: internal z-scores (not plotted) for concept clarity
Why it’s useful
• Shows when trend & breakout align (clean regimes) vs conflict (chop)
• Helps explain why volatility-aware systems size up in smooth trends and scale down in noise
How to read it
• EMA64 above EMA256 with price near/above Donchian high → trend-following alignment
• EMA64 below EMA256 with price near/below Donchian low → bearish alignment
• Inside channel with EMAs tangled → range/chop risk
Notes
• Indicator is educational only (no orders).
• Built entirely with TradingView built-ins.
• For consistent visuals: enable “Indicator values on price scale” and disable “Scale price chart only” in Settings → Scales.
オープンソーススクリプト
TradingViewの精神に則り、このスクリプトの作者はコードをオープンソースとして公開してくれました。トレーダーが内容を確認・検証できるようにという配慮です。作者に拍手を送りましょう!無料で利用できますが、コードの再公開はハウスルールに従う必要があります。
📊 Access & Subscription → algorific.gumroad.com/
💬 After purchase, DM @Algorific on TradingView for invite-only access.
💬 After purchase, DM @Algorific on TradingView for invite-only access.
免責事項
この情報および投稿は、TradingViewが提供または推奨する金融、投資、トレード、その他のアドバイスや推奨を意図するものではなく、それらを構成するものでもありません。詳細は利用規約をご覧ください。