OPEN-SOURCE SCRIPT
更新済 RAT Momentum Squeeze BETA
V1.0
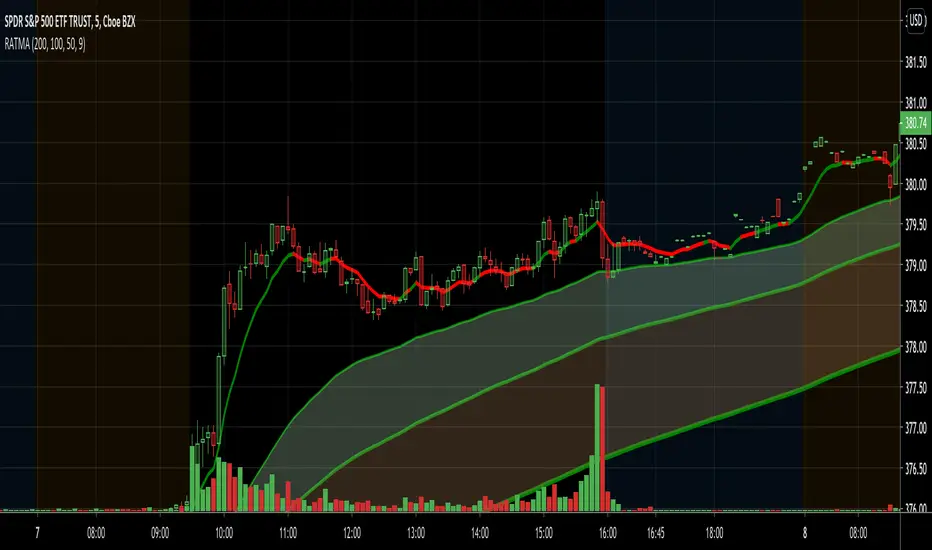
MAs are a great tool to measure the market's momentum. I created this indicator to graphically depict bullish and banishment movements with the moving averages.
Using the 50, 100, & 200 day MA in conjunction with the RSI we are able to find great swing setups. This is used best on the 30min & up to the daily chart.
リリースノート
*Cleaned up codeリリースノート
V1.0 Release NotesAdded 9-day moving average with dynamic color based on 9-day RSI over/oversold levels
Added dynamic color changing to all moving averages based on the directional movement
リリースノート
Added conditional formatting to the colors on the 9-day moving average. The greener the color, the more overbought. The darker the red, the more oversold. I will tweak the colors of the cloud and line itself in a future update.リリースノート
Exciting new update :)-Added improved accuracy for the strength in the trend by calculating different RSI lengths
-Added bar overlays to help show the strength of the trend
-Improved colors on the 9 day MA overlay

リリースノート
Switched MAs to EMAs. After doing extensive backtesting I think EMAs are much more accurate for the purpose of this indicator リリースノート
Changed SMAs to EMAs for improved accuracy リリースノート
changed RSI sensitivity オープンソーススクリプト
TradingViewの精神に則り、このスクリプトの作者はコードをオープンソースとして公開してくれました。トレーダーが内容を確認・検証できるようにという配慮です。作者に拍手を送りましょう!無料で利用できますが、コードの再公開はハウスルールに従う必要があります。
免責事項
この情報および投稿は、TradingViewが提供または推奨する金融、投資、トレード、その他のアドバイスや推奨を意図するものではなく、それらを構成するものでもありません。詳細は利用規約をご覧ください。
オープンソーススクリプト
TradingViewの精神に則り、このスクリプトの作者はコードをオープンソースとして公開してくれました。トレーダーが内容を確認・検証できるようにという配慮です。作者に拍手を送りましょう!無料で利用できますが、コードの再公開はハウスルールに従う必要があります。
免責事項
この情報および投稿は、TradingViewが提供または推奨する金融、投資、トレード、その他のアドバイスや推奨を意図するものではなく、それらを構成するものでもありません。詳細は利用規約をご覧ください。