OPEN-SOURCE SCRIPT
更新済 Dynamic 4-Hour Candle (Accurate Highs and Lows)
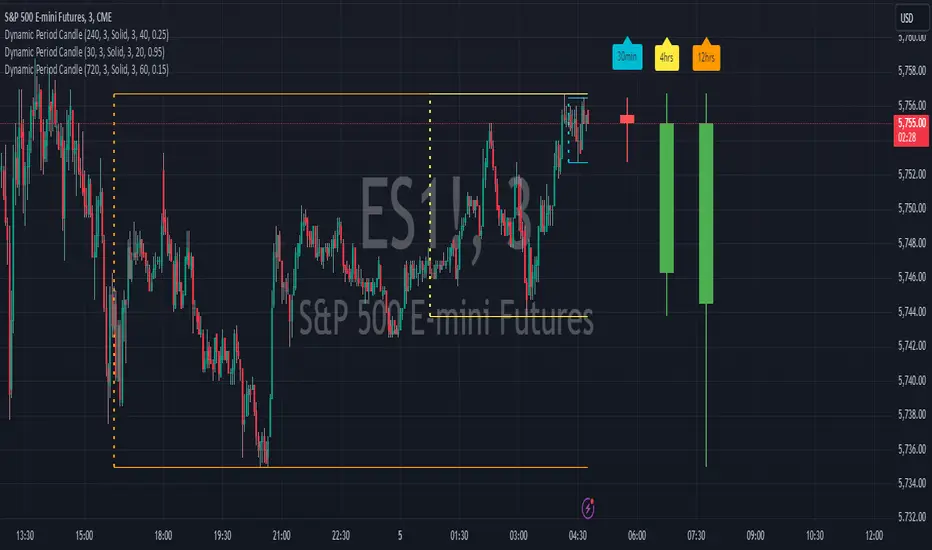
This gives a dynamic 4 hour history of the current price, so that you can assess the current trend. I found lots of indicators that looked at the previous 4 hr candle, but they then immediately switched to the new 4 hr candle when it started to be formed. this indicator looks back at the rolling previous 4 hours.
リリースノート
This is version 2 of this indicator. It allows you to change the look back period and the time frame of the chart that you are using it on. リリースノート
I also think that the candle is more accurate now in its representation of the previous time period specified, but please feel free to improve on this yourselves!リリースノート
added a setting to reposition the indicator on the chartリリースノート
I've added a label that you can put above the candle, as it can be useful having a few of these on the chart covering different time frames, and the labels avoid any confusion as to what each candle represents.リリースノート
I've now added a line that you can add on the chart to show where each look back period is. This can be colour coded to match your labels, so you can clearly see which time period is being measured by witch line.リリースノート
Tidied teh label so that it now displays the hours instead of the minutes, if necessary.リリースノート
Added in optional high low lines on the chart for the time period, so you can easily see them if you prefer to have them up on the chart.オープンソーススクリプト
TradingViewの精神に則り、このスクリプトの作者はコードをオープンソースとして公開してくれました。トレーダーが内容を確認・検証できるようにという配慮です。作者に拍手を送りましょう!無料で利用できますが、コードの再公開はハウスルールに従う必要があります。
免責事項
この情報および投稿は、TradingViewが提供または推奨する金融、投資、トレード、その他のアドバイスや推奨を意図するものではなく、それらを構成するものでもありません。詳細は利用規約をご覧ください。
オープンソーススクリプト
TradingViewの精神に則り、このスクリプトの作者はコードをオープンソースとして公開してくれました。トレーダーが内容を確認・検証できるようにという配慮です。作者に拍手を送りましょう!無料で利用できますが、コードの再公開はハウスルールに従う必要があります。
免責事項
この情報および投稿は、TradingViewが提供または推奨する金融、投資、トレード、その他のアドバイスや推奨を意図するものではなく、それらを構成するものでもありません。詳細は利用規約をご覧ください。