OPEN-SOURCE SCRIPT
更新済 Crunchster's Real Price
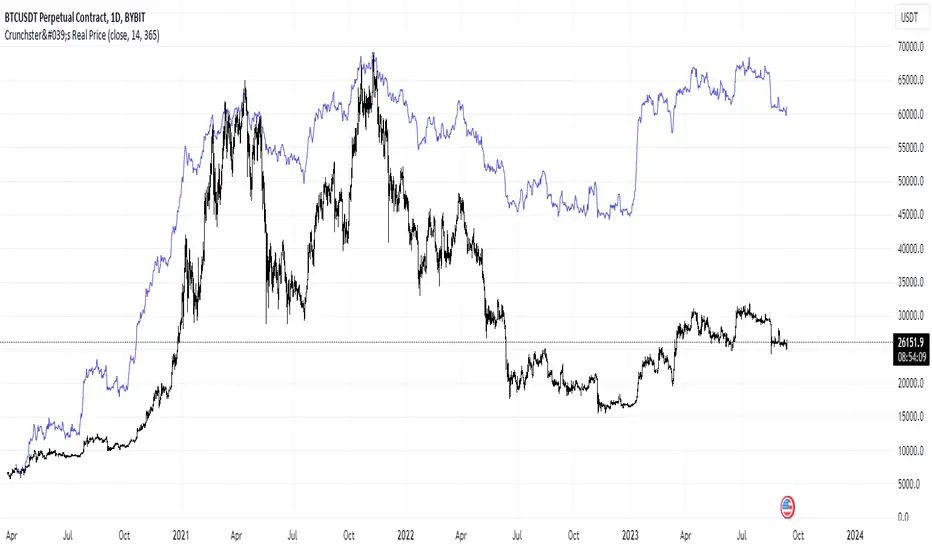
This is a simple transformation of any price series (best suited to daily timeframe) that filters out random price fluctuations and revealing the "real" price action. It allows comparison between different assets easily and is a useful confirmation of support and resistance levels, or can be used with other technical analysis.
In the default settings based on a daily chart, the daily returns are first calculated, then volatility normalised by dividing by the standard deviation of daily returns over the defined lookback period (14 periods by default).
These normalised returns are then added together over the entire price series period, to create a new "Real price" - the volatility adjusted price. This is the default presentation.
In addition, a second signal ("Normalised price series over rolling period") is available which, instead of summing the normalised returns over the entire price series, allows a user configurable, rolling lookback window over which the normalised returns are summed up. The default setting is 365 periods (ie 1 year on the daily timeframe for tickers with 24hr markets such as crypto. This can be set to 252 periods if analysing equities, which only trade 5 days per week, or any other user defined period of interest).
リリースノート
Added configurable sourceリリースノート
Updated to overlay main chartオープンソーススクリプト
TradingViewの精神に則り、このスクリプトの作者はコードをオープンソースとして公開してくれました。トレーダーが内容を確認・検証できるようにという配慮です。作者に拍手を送りましょう!無料で利用できますが、コードの再公開はハウスルールに従う必要があります。
Join me on Mizar.com and trade my strategies
免責事項
この情報および投稿は、TradingViewが提供または推奨する金融、投資、トレード、その他のアドバイスや推奨を意図するものではなく、それらを構成するものでもありません。詳細は利用規約をご覧ください。
オープンソーススクリプト
TradingViewの精神に則り、このスクリプトの作者はコードをオープンソースとして公開してくれました。トレーダーが内容を確認・検証できるようにという配慮です。作者に拍手を送りましょう!無料で利用できますが、コードの再公開はハウスルールに従う必要があります。
Join me on Mizar.com and trade my strategies
免責事項
この情報および投稿は、TradingViewが提供または推奨する金融、投資、トレード、その他のアドバイスや推奨を意図するものではなく、それらを構成するものでもありません。詳細は利用規約をご覧ください。