PROTECTED SOURCE SCRIPT
C-Multi TimeFrame RSI V1.0
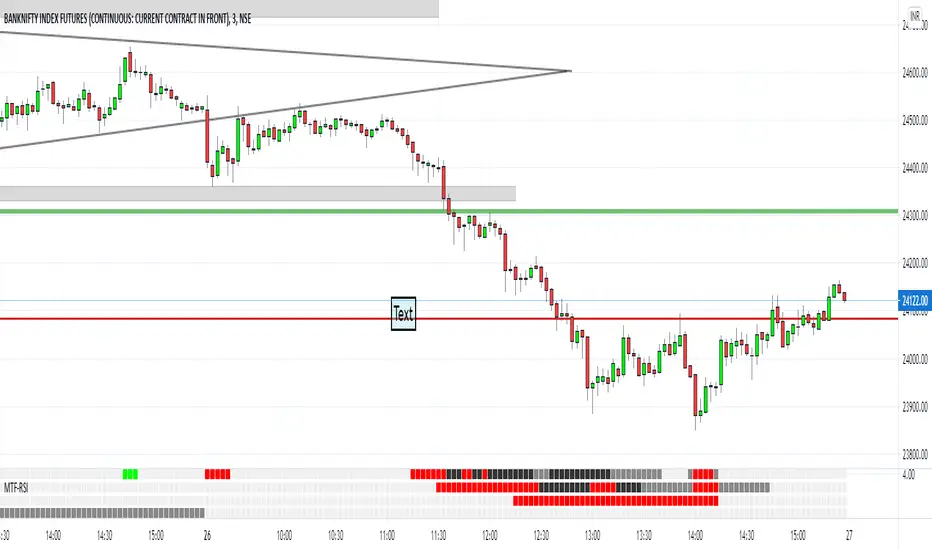
C-Multi TimeFrame RSI V1.0 shows multi time frame RSI signals. It indicates color based on 21EMA on RSI and the RSI values.
RSI is above 75 - Black (Over Bought)
RSI is between 61 and 75, additionally if RSI is greater than 21 EMA on RSI, it shows Green. otherwise it shows gray
RIS is between 61 and 38, No indication
RSI is between 38 and 25, additionally if RSI is less than 21 EMA on RSI, it shows Red. otherwise it shows gray
RSI is below 25 - Black (Over Sold)
By Default the Indicator shows,
5 Minutes RSI on top, 15 Minutes, 1 Hour and 4 Hours RSI interpretation subsequently.
保護スクリプト
このスクリプトのソースコードは非公開で投稿されています。 ただし、制限なく自由に使用できます – 詳細はこちらでご確認ください。
免責事項
この情報および投稿は、TradingViewが提供または推奨する金融、投資、トレード、その他のアドバイスや推奨を意図するものではなく、それらを構成するものでもありません。詳細は利用規約をご覧ください。
保護スクリプト
このスクリプトのソースコードは非公開で投稿されています。 ただし、制限なく自由に使用できます – 詳細はこちらでご確認ください。
免責事項
この情報および投稿は、TradingViewが提供または推奨する金融、投資、トレード、その他のアドバイスや推奨を意図するものではなく、それらを構成するものでもありません。詳細は利用規約をご覧ください。