OPEN-SOURCE SCRIPT
Price Relative / Relative Strength Comparative [NeoButane]
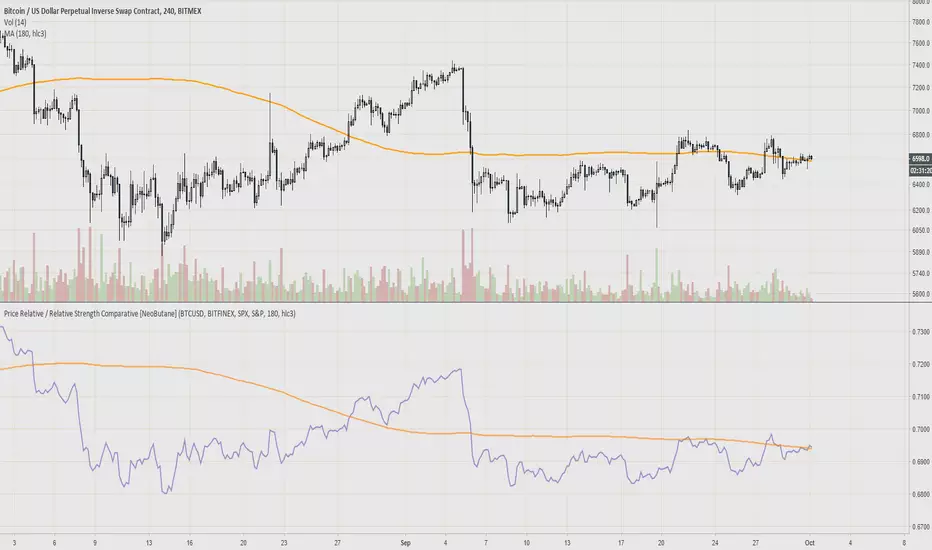
"The Price Relative indicator compares the performance of one security to another with a ratio chart."
Divergences and chart patterns can apply to this ratio.
This was created because I wanted to compare bitcoin to currency/stock indices. So far I've seen mostly confluence with cryptos. Comparing stocks against market indices better shows where the index begins to outperform the stock before price action can reveal dips in price. Using same length moving averages or divergences can help spot that.
There's a glitch where candle colors turn blue when editing. Turn the candles on and off to fix it.
Reference: stockcharts.com/school/doku.php?id=chart_school:technical_indicators:price_relative
Formula:
Price Relative = Base Security / Comparative Security
Ratio Symbol Close = Close of First Symbol / Close of Second Symbol
Ratio Symbol Open = Open of First Symbol / Close of Second Symbol
Ratio Symbol High = High of First Symbol / Close of Second Symbol
Ratio Symbol Low = Low of First Symbol / Close of Second Symbol
Note: Although StockCharts states
"Base Security / Comparative Security"
I've used
"Base Security / (Base Security + Comparative Security)
to create a ratio as the article has stated it should be.
Possible use: margin/CVD
オープンソーススクリプト
TradingViewの精神に則り、このスクリプトの作者はコードをオープンソースとして公開してくれました。トレーダーが内容を確認・検証できるようにという配慮です。作者に拍手を送りましょう!無料で利用できますが、コードの再公開はハウスルールに従う必要があります。
My published indicators: tradingview.com/u/NeoButane/
Sorry if I haven't replied to your message yet, I'm a bit backlogged :)
Sorry if I haven't replied to your message yet, I'm a bit backlogged :)
免責事項
この情報および投稿は、TradingViewが提供または推奨する金融、投資、トレード、その他のアドバイスや推奨を意図するものではなく、それらを構成するものでもありません。詳細は利用規約をご覧ください。