OPEN-SOURCE SCRIPT
Extended Support and Resistance Levels

Indicator: Extended Support and Resistance Levels
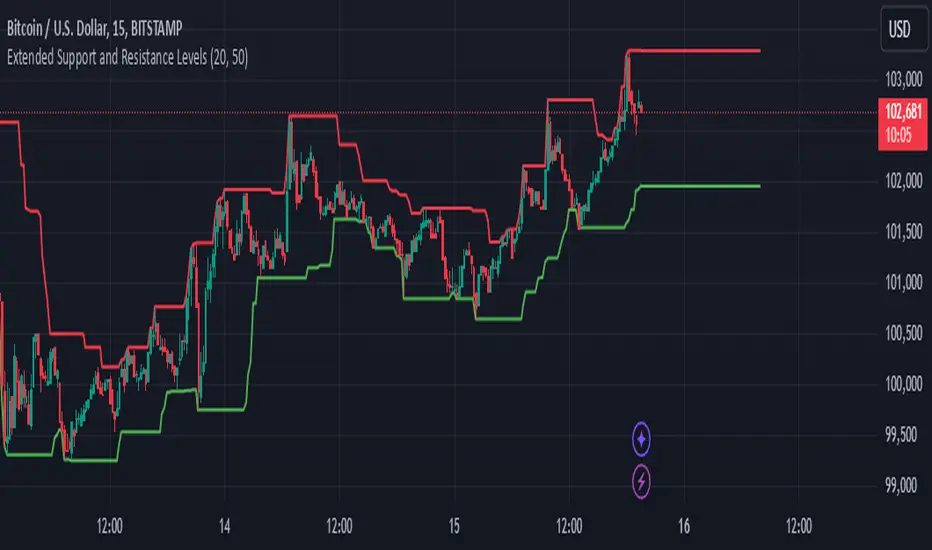
This Pine Script indicator dynamically calculates support and resistance levels based on recent price action and projects these levels into the future.
Support is determined by the lowest low over a user-defined period, while Resistance is defined by the highest high over the same period.
The indicator draws lines at the calculated support and resistance levels and extends them into the future, allowing traders to visualize potential future levels where price might react.
The extension of these lines helps in identifying areas where price may respect support or resistance in the upcoming bars.
The user can adjust the period for support/resistance calculation and the number of bars for projection, providing flexibility to adapt to different timeframes and market conditions.
This tool is ideal for traders looking to anticipate future key price levels based on historical price data, helping with decision-making on potential entry or exit points.
オープンソーススクリプト
TradingViewの精神に則り、このスクリプトの作者はコードをオープンソースとして公開してくれました。トレーダーが内容を確認・検証できるようにという配慮です。作者に拍手を送りましょう!無料で利用できますが、コードの再公開はハウスルールに従う必要があります。
免責事項
この情報および投稿は、TradingViewが提供または推奨する金融、投資、トレード、その他のアドバイスや推奨を意図するものではなく、それらを構成するものでもありません。詳細は利用規約をご覧ください。
オープンソーススクリプト
TradingViewの精神に則り、このスクリプトの作者はコードをオープンソースとして公開してくれました。トレーダーが内容を確認・検証できるようにという配慮です。作者に拍手を送りましょう!無料で利用できますが、コードの再公開はハウスルールに従う必要があります。
免責事項
この情報および投稿は、TradingViewが提供または推奨する金融、投資、トレード、その他のアドバイスや推奨を意図するものではなく、それらを構成するものでもありません。詳細は利用規約をご覧ください。