OPEN-SOURCE SCRIPT
更新済 Parabolic sar with breaks
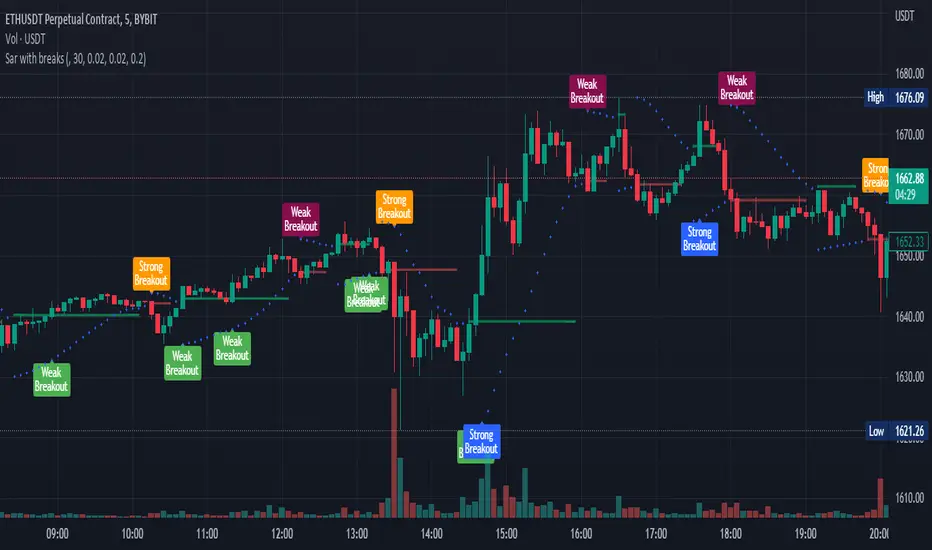
This plots a Parabolic sar and a break line on the previous sar point before the parabolic sar flips.
This is looking to be a very popular entry signal for lots of strats.
How to use:
In conjunction with other confirmation indicators;
Long: Enter long when the Parabolic sar is below the price and the price breaks above (and closes) the break line.
Short: Enter short when the Parabolic sar is above the price and the price breaks below (and closes) the break line.
A great indicator combination for this is to use a 200 ema for price trend and volume flow.
リリースノート
Added long and short labels that show when the psar line is broken with high volumeリリースノート
Changed chartAdded check that labels should not show if the breaking candle has a long wick
リリースノート
removed wick check as it was buggyリリースノート
Only show signals when parabolic sar is bullish/bearish.リリースノート
Selectable timeframeリリースノート
Added alerts and changed breakout labels.After some research, I have found that when a parabolic Sar Breakout line is broken by price with high volume, it is much more likely to continue in that direction, and so I have have added strong and weak breakout labels.
You are able to show/hide them individually.
オープンソーススクリプト
TradingViewの精神に則り、このスクリプトの作者はコードをオープンソースとして公開してくれました。トレーダーが内容を確認・検証できるようにという配慮です。作者に拍手を送りましょう!無料で利用できますが、コードの再公開はハウスルールに従う必要があります。
免責事項
この情報および投稿は、TradingViewが提供または推奨する金融、投資、トレード、その他のアドバイスや推奨を意図するものではなく、それらを構成するものでもありません。詳細は利用規約をご覧ください。
オープンソーススクリプト
TradingViewの精神に則り、このスクリプトの作者はコードをオープンソースとして公開してくれました。トレーダーが内容を確認・検証できるようにという配慮です。作者に拍手を送りましょう!無料で利用できますが、コードの再公開はハウスルールに従う必要があります。
免責事項
この情報および投稿は、TradingViewが提供または推奨する金融、投資、トレード、その他のアドバイスや推奨を意図するものではなく、それらを構成するものでもありません。詳細は利用規約をご覧ください。