OPEN-SOURCE SCRIPT
更新済 DJ Soori Trading Strategy

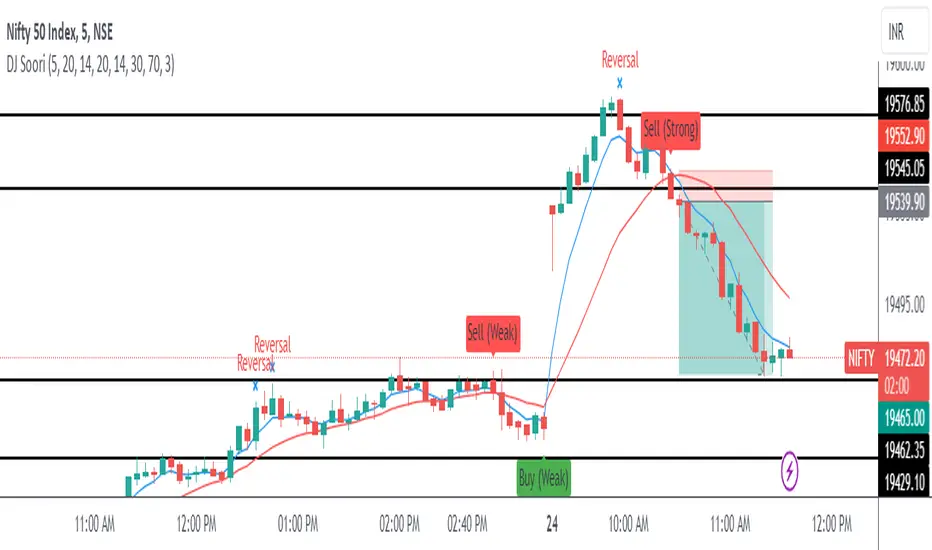
The strategy combines three indicators: Exponential Moving Average (EMA), Weighted Moving Average (WMA), and Average Directional Index (ADX).
The EMA and WMA are used to track the average price over different time periods.
The ADX measures the strength of a trend in the market.
The strategy generates buy signals when the EMA is higher than the WMA and the ADX is above a certain threshold. It suggests a potential uptrend.
It generates sell signals when the EMA is lower than the WMA and the ADX is above the threshold. It suggests a potential downtrend.
The strategy also considers whether the ADX is rising or falling to indicate the strength of the trend.
The EMA, WMA, and ADX values are plotted on the chart.
Buy and sell signals are shown as labels on the chart, indicating "Buy (Strong)" or "Buy (Weak)" for buy signals, and "Sell (Strong)" or "Sell (Weak)" for sell signals.
リリースノート
The strategy combines three indicators: Exponential Moving Average (EMA), Weighted Moving Average (WMA), and Average Directional Index (ADX).EMA and WMA track the average price over different time periods.
ADX measures the strength of a trend in the market.
Buy signals:
Generated when EMA is higher than WMA and ADX is above a threshold.
Indicates a potential uptrend.
Sell signals:
Generated when EMA is lower than WMA and ADX is above the threshold.
Indicates a potential downtrend.
The strategy considers the rising or falling nature of ADX to assess the strength of the trend.
The chart displays the EMA, WMA, and ADX values.
Buy and sell signals are indicated on the chart as labels:
"Buy (Strong)" or "Buy (Weak)" for buy signals.
"Sell (Strong)" or "Sell (Weak)" for sell signals.
This strategy helps identify potential trends and provides buy/sell signals based on the EMA-WMA crossover and ADX strength.
リリースノート
Updated barstate codes リリースノート
Book profit has been changed to reversal signリリースノート
Some new changes added リリースノート
Updated EMA and WMAオープンソーススクリプト
TradingViewの精神に則り、このスクリプトの作者はコードをオープンソースとして公開してくれました。トレーダーが内容を確認・検証できるようにという配慮です。作者に拍手を送りましょう!無料で利用できますが、コードの再公開はハウスルールに従う必要があります。
免責事項
この情報および投稿は、TradingViewが提供または推奨する金融、投資、トレード、その他のアドバイスや推奨を意図するものではなく、それらを構成するものでもありません。詳細は利用規約をご覧ください。
オープンソーススクリプト
TradingViewの精神に則り、このスクリプトの作者はコードをオープンソースとして公開してくれました。トレーダーが内容を確認・検証できるようにという配慮です。作者に拍手を送りましょう!無料で利用できますが、コードの再公開はハウスルールに従う必要があります。
免責事項
この情報および投稿は、TradingViewが提供または推奨する金融、投資、トレード、その他のアドバイスや推奨を意図するものではなく、それらを構成するものでもありません。詳細は利用規約をご覧ください。