OPEN-SOURCE SCRIPT
ReNKoLiNe - A line on chart mimicking RENKO bricks
DESCRIPTION
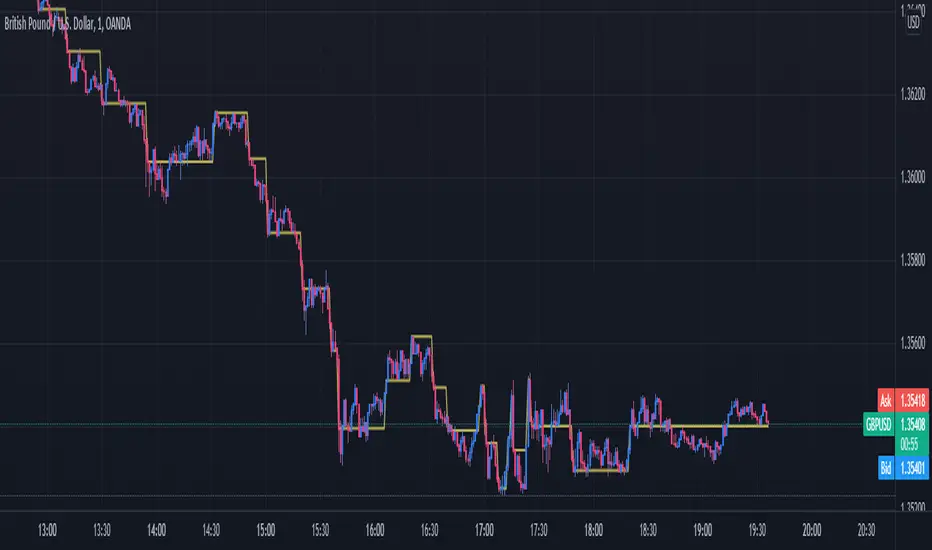
RENKOLINE Indicator - mimics RENKO charts on ANY timeframe. It is not absolutely fixed, which is actually an advantage,
because it does not close bricks before the actual close of a candle.
An advantage, if one knows how to play with the "bricksize"
Of course it has a short side of delaying entry in case the direction momentum continues.
CDL is difference between current close and the RenkoLine i.e. distance to Candle(close) to Line(renko). This could provide idea for the deviation between candle close and line value.
It is only a value. I did not find a way to draw it properly.
Someone more experienced could help :)
オープンソーススクリプト
TradingViewの精神に則り、このスクリプトの作者はコードをオープンソースとして公開してくれました。トレーダーが内容を確認・検証できるようにという配慮です。作者に拍手を送りましょう!無料で利用できますが、コードの再公開はハウスルールに従う必要があります。
免責事項
この情報および投稿は、TradingViewが提供または推奨する金融、投資、トレード、その他のアドバイスや推奨を意図するものではなく、それらを構成するものでもありません。詳細は利用規約をご覧ください。
オープンソーススクリプト
TradingViewの精神に則り、このスクリプトの作者はコードをオープンソースとして公開してくれました。トレーダーが内容を確認・検証できるようにという配慮です。作者に拍手を送りましょう!無料で利用できますが、コードの再公開はハウスルールに従う必要があります。
免責事項
この情報および投稿は、TradingViewが提供または推奨する金融、投資、トレード、その他のアドバイスや推奨を意図するものではなく、それらを構成するものでもありません。詳細は利用規約をご覧ください。