OPEN-SOURCE SCRIPT
更新済 OHLC 0.5 @Splints
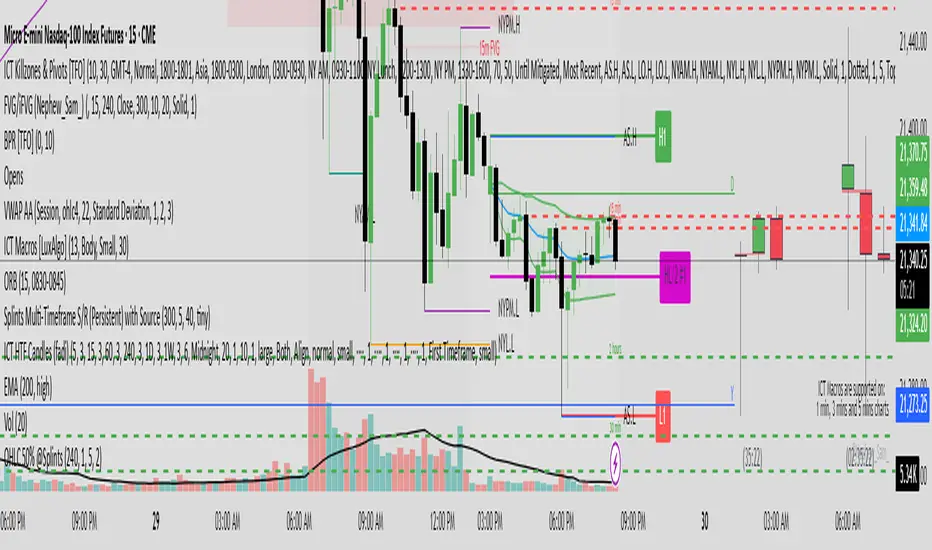
This indicator provides a dynamic visualization of OHLC levels, allowing traders to analyze price action across multiple candles with enhanced clarity. It features customizable options for timeframe selection, candle count, and mid-level calculations (High/Low 50% and Open/Close 50%). The script utilizes gradient-based coloring for a clear distinction between levels and supports dynamic extension for better visibility.
Key Features:
Displays Open, High, Low, and Close levels with adjustable extension lengths
Supports mid-level calculations for enhanced trade decision-making
Gradient coloring for improved visual clarity across multiple candles
Configurable labels for quick reference to key price points
Efficient object management using arrays for optimized performance
Perfect for traders seeking structured insights into candle dynamics and session-based analysis.
リリースノート
- Removed open/close lineリリースノート
Fix bug causing lines to moveオープンソーススクリプト
TradingViewの精神に則り、このスクリプトの作者はコードをオープンソースとして公開してくれました。トレーダーが内容を確認・検証できるようにという配慮です。作者に拍手を送りましょう!無料で利用できますが、コードの再公開はハウスルールに従う必要があります。
免責事項
この情報および投稿は、TradingViewが提供または推奨する金融、投資、トレード、その他のアドバイスや推奨を意図するものではなく、それらを構成するものでもありません。詳細は利用規約をご覧ください。
オープンソーススクリプト
TradingViewの精神に則り、このスクリプトの作者はコードをオープンソースとして公開してくれました。トレーダーが内容を確認・検証できるようにという配慮です。作者に拍手を送りましょう!無料で利用できますが、コードの再公開はハウスルールに従う必要があります。
免責事項
この情報および投稿は、TradingViewが提供または推奨する金融、投資、トレード、その他のアドバイスや推奨を意図するものではなく、それらを構成するものでもありません。詳細は利用規約をご覧ください。