OPEN-SOURCE SCRIPT
更新済 MarketTrend [AlchimistOfCrypto]
🌌 MarketTrend [AlchimistOfCrypto] – Unveil the Cosmic Harmony of Markets 🌌
"What we call 'trend' is merely an illusion of our limited perception of the space-time continuum of markets. Pivots are points of singularity where potential energy ⚡️ transforms into kinetic energy 🚀. The fourth dimension isn’t just time—it’s the simultaneous awareness of all temporal states. By observing mathematical laws across time scales, we unlock the secrets of the cosmic harmony of markets."
📊 Technical Overview
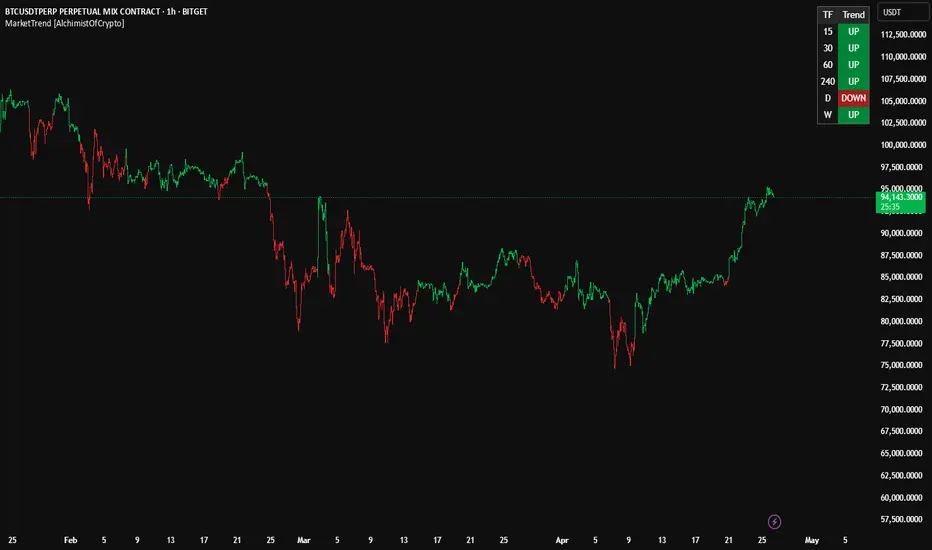
MarketTrend is a multi-timeframe trend analysis powerhouse 🔥 that tracks market direction across six timeframes simultaneously. It pinpoints pivot points 📍 to classify trends as bullish 🐂, bearish 🐻, or neutral ⚖️, presenting results in a sleek, easy-to-read table.
⚙️ How It Works
- The algorithm scans for pivot highs and pivot lows using a 20-bar lookback period 🔍.
- Bullish Trend 🟢: Price breaks above a previous pivot high.
- Bearish Trend 🔴: Price drops below a previous pivot low.
- Neutral Zone 🟡: Price consolidates until a breakout sparks a new trend.
🚀 How to Use This Indicator
1. Master Multi-Timeframe Analysis 🌍: Spot trend alignment across timeframes for a holistic view.
2. Seek Confluence ✅: Stronger signals emerge when multiple timeframes align.
3. Time Your Entries ⏰: Enter trades when shorter timeframes sync with larger ones for maximum precision.
4. Manage Risk 🛡️: Avoid countertrend trades when timeframes show unified direction.
"What we call 'trend' is merely an illusion of our limited perception of the space-time continuum of markets. Pivots are points of singularity where potential energy ⚡️ transforms into kinetic energy 🚀. The fourth dimension isn’t just time—it’s the simultaneous awareness of all temporal states. By observing mathematical laws across time scales, we unlock the secrets of the cosmic harmony of markets."
📊 Technical Overview
MarketTrend is a multi-timeframe trend analysis powerhouse 🔥 that tracks market direction across six timeframes simultaneously. It pinpoints pivot points 📍 to classify trends as bullish 🐂, bearish 🐻, or neutral ⚖️, presenting results in a sleek, easy-to-read table.
⚙️ How It Works
- The algorithm scans for pivot highs and pivot lows using a 20-bar lookback period 🔍.
- Bullish Trend 🟢: Price breaks above a previous pivot high.
- Bearish Trend 🔴: Price drops below a previous pivot low.
- Neutral Zone 🟡: Price consolidates until a breakout sparks a new trend.
🚀 How to Use This Indicator
1. Master Multi-Timeframe Analysis 🌍: Spot trend alignment across timeframes for a holistic view.
2. Seek Confluence ✅: Stronger signals emerge when multiple timeframes align.
3. Time Your Entries ⏰: Enter trades when shorter timeframes sync with larger ones for maximum precision.
4. Manage Risk 🛡️: Avoid countertrend trades when timeframes show unified direction.
リリースノート
Add the candle Colorリリースノート
Wick on candleオープンソーススクリプト
TradingViewの精神に則り、このスクリプトの作者はコードをオープンソースとして公開してくれました。トレーダーが内容を確認・検証できるようにという配慮です。作者に拍手を送りましょう!無料で利用できますが、コードの再公開はハウスルールに従う必要があります。
My Website for the traders !
免責事項
この情報および投稿は、TradingViewが提供または推奨する金融、投資、トレード、その他のアドバイスや推奨を意図するものではなく、それらを構成するものでもありません。詳細は利用規約をご覧ください。
オープンソーススクリプト
TradingViewの精神に則り、このスクリプトの作者はコードをオープンソースとして公開してくれました。トレーダーが内容を確認・検証できるようにという配慮です。作者に拍手を送りましょう!無料で利用できますが、コードの再公開はハウスルールに従う必要があります。
My Website for the traders !
免責事項
この情報および投稿は、TradingViewが提供または推奨する金融、投資、トレード、その他のアドバイスや推奨を意図するものではなく、それらを構成するものでもありません。詳細は利用規約をご覧ください。