OPEN-SOURCE SCRIPT
更新済 Linear Regression Fan [LuxAlgo]

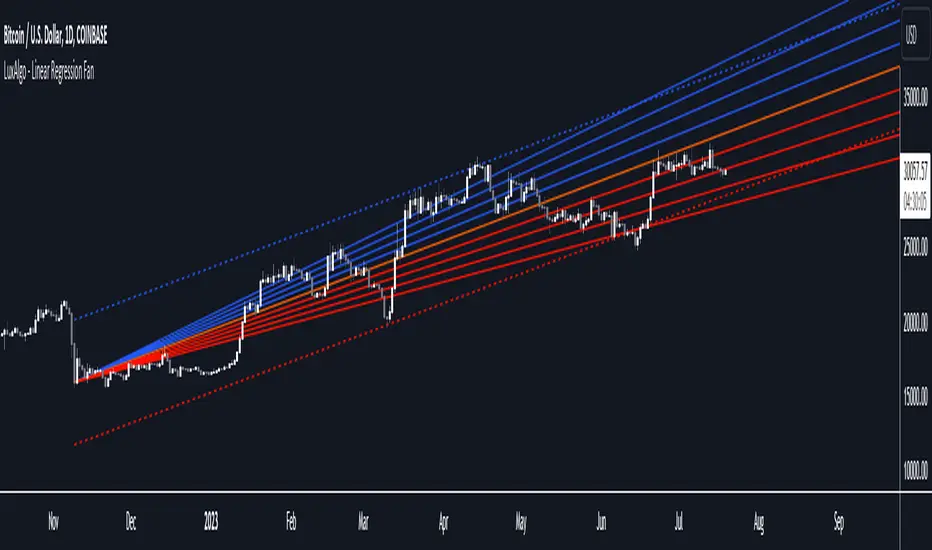
This indicator displays a fan using a linear regression fit to the price as a base. All lines are equidistant and are drawn from the first point of the linear regression to the most recent point of the linear regression plus the root-mean-square deviation (RMSD) multiplied by a certain factor.
Settings
Usage
Traders often use the lines of fans to determine significant points of support or resistance at which they might expect price variations to reverse.
The length can be adjusted so that the starting point of the linear regression is located at a pivot high/low.

Some technical analysts use the measure rule of broadening wedges with fans when price breaks one of the extremities. This allows setting precise take-profits/stop-losses.

To learn more about the measure rule see:

Settings
- Length: Lookback period for the linear regression.
- Mult: Multiplier for the RMSD, allows returning wider fans.
- Lines Per Side: Number of lines on each side of the fan.
- Src: Input source of the indicator.
Usage
Traders often use the lines of fans to determine significant points of support or resistance at which they might expect price variations to reverse.
The length can be adjusted so that the starting point of the linear regression is located at a pivot high/low.
Some technical analysts use the measure rule of broadening wedges with fans when price breaks one of the extremities. This allows setting precise take-profits/stop-losses.
To learn more about the measure rule see:

リリースノート
Minor changes.リリースノート
Switched to version 5 and made calculation of the indicator based on the user-selected anchor points, thus preventing repainting.オープンソーススクリプト
TradingViewの精神に則り、このスクリプトの作者はコードをオープンソースとして公開してくれました。トレーダーが内容を確認・検証できるようにという配慮です。作者に拍手を送りましょう!無料で利用できますが、コードの再公開はハウスルールに従う必要があります。
Build your own edge with AI: luxalgo.com
All content provided by LuxAlgo is for informational & educational purposes only. Past performance does not guarantee future results.
All content provided by LuxAlgo is for informational & educational purposes only. Past performance does not guarantee future results.
免責事項
この情報および投稿は、TradingViewが提供または推奨する金融、投資、トレード、その他のアドバイスや推奨を意図するものではなく、それらを構成するものでもありません。詳細は利用規約をご覧ください。
オープンソーススクリプト
TradingViewの精神に則り、このスクリプトの作者はコードをオープンソースとして公開してくれました。トレーダーが内容を確認・検証できるようにという配慮です。作者に拍手を送りましょう!無料で利用できますが、コードの再公開はハウスルールに従う必要があります。
Build your own edge with AI: luxalgo.com
All content provided by LuxAlgo is for informational & educational purposes only. Past performance does not guarantee future results.
All content provided by LuxAlgo is for informational & educational purposes only. Past performance does not guarantee future results.
免責事項
この情報および投稿は、TradingViewが提供または推奨する金融、投資、トレード、その他のアドバイスや推奨を意図するものではなく、それらを構成するものでもありません。詳細は利用規約をご覧ください。