OPEN-SOURCE SCRIPT
更新済 Pro Momentum Calculator
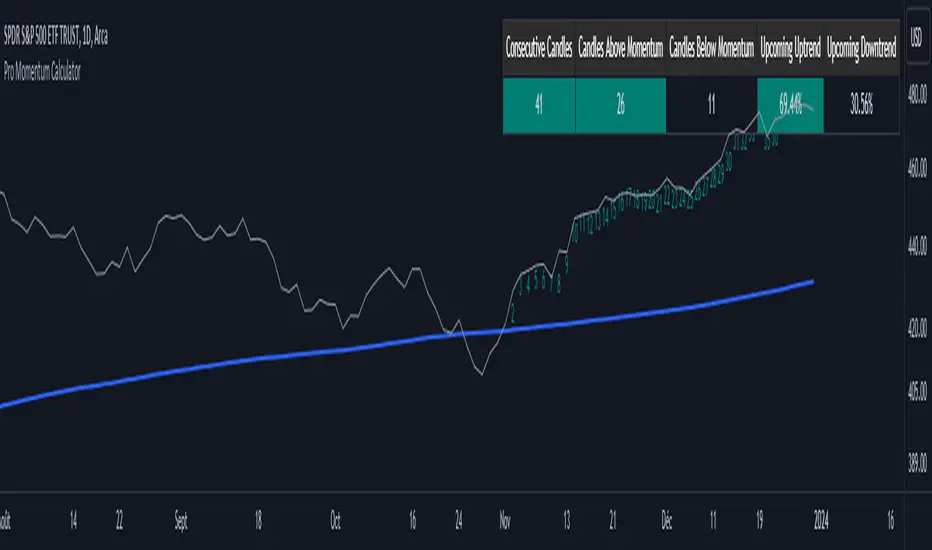
The Pro Momentum Calculator Indicator is a tool for traders seeking to gauge market momentum and predict future price movements. It achieves this by counting consecutive candle periods above or below a chosen Simple Moving Average (SMA) and then providing a percentage-based probability for the direction of the next candle.
Here's how this principle works:
1. Counting Consecutive Periods: The indicator continuously tracks whether the closing prices of candles are either above or below the chosen SMA.
- When closing prices are above the SMA, it counts consecutive periods as "green" or indicating potential upward momentum.
- When closing prices are below the SMA, it counts consecutive periods as "red" or suggesting potential downward momentum.
2. Assessing Momentum: By monitoring these consecutive periods, the indicator assesses the strength and duration of the current market trend.
This is important information for traders looking to understand the market's behavior.
3. Predicting the Next Candle: Based on the historical data of consecutive green and red periods, the indicator calculates a percentage probability for the direction of the next candle:
- If there have been more consecutive green periods, it suggests a higher likelihood of the next candle being green (indicating a potential upward movement).
- If there have been more consecutive red periods, it suggests a higher likelihood of the next candle being red (indicating a potential downward movement).
The Pro Momentum Calculator indicator's versatility makes it suitable for a wide range of financial markets, including stocks, Forex, indices, commodities, cryptocurrencies...
リリースノート
Option to use Heikin Ashi candles removedリリースノート
minor changesリリースノート
EMA calculation added in addition to SMAリリースノート
Minor changesリリースノート
Minor adjustments madeオープンソーススクリプト
TradingViewの精神に則り、このスクリプトの作者はコードをオープンソースとして公開してくれました。トレーダーが内容を確認・検証できるようにという配慮です。作者に拍手を送りましょう!無料で利用できますが、コードの再公開はハウスルールに従う必要があります。
Plan the trade ⚡ Trade the plan
免責事項
この情報および投稿は、TradingViewが提供または推奨する金融、投資、トレード、その他のアドバイスや推奨を意図するものではなく、それらを構成するものでもありません。詳細は利用規約をご覧ください。
オープンソーススクリプト
TradingViewの精神に則り、このスクリプトの作者はコードをオープンソースとして公開してくれました。トレーダーが内容を確認・検証できるようにという配慮です。作者に拍手を送りましょう!無料で利用できますが、コードの再公開はハウスルールに従う必要があります。
Plan the trade ⚡ Trade the plan
免責事項
この情報および投稿は、TradingViewが提供または推奨する金融、投資、トレード、その他のアドバイスや推奨を意図するものではなく、それらを構成するものでもありません。詳細は利用規約をご覧ください。