OPEN-SOURCE SCRIPT
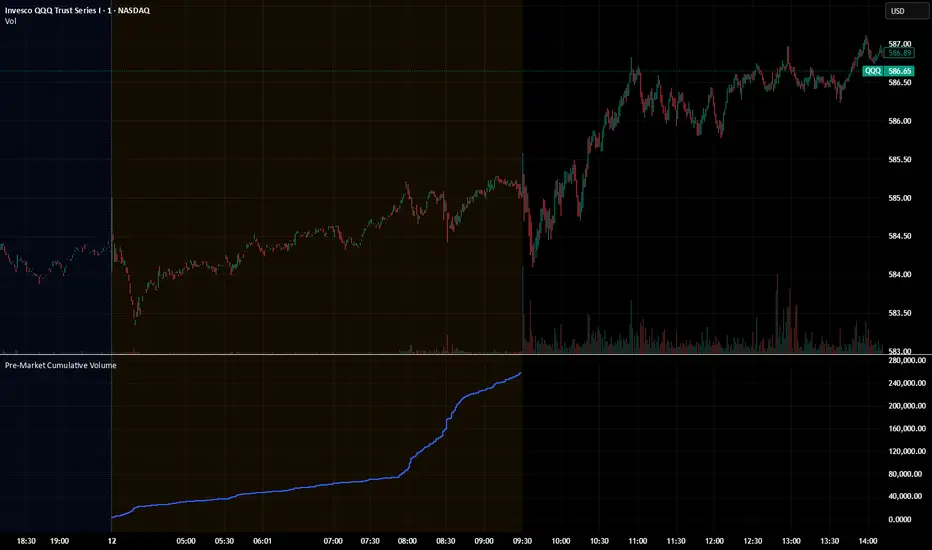
Pre‑Market Cumulative Volume
Description:
This indicator plots the cumulative trading volume for the pre‑market session on intraday charts. It automatically detects when a bar is part of the extended pre‑market period using TradingView’s built‑in session variables, starts a new running total at the first pre‑market bar of each day, and resets at the beginning of regular trading hours. During regular market hours or the post‑market session, the indicator does not display values.
To use this script effectively, ensure extended‑hour data is enabled on the chart, and select an intraday timeframe where pre‑market data is available. The result is a simple yet powerful tool for monitoring cumulative pre‑market activity.
How to use
Add the script to a chart and make sure you are on an intraday timeframe (e.g., 1‑min, 5‑min). Extended‑hour data must be enabled; otherwise session.ispremarket will always be false.
During each pre‑market session, the indicator will reset at the first pre‑market bar and then accumulate the volume of subsequent pre‑market bars.
Outside the pre‑market (regular trading hours and post‑market), the plot outputs na, so it does not draw on those bars.
Customization (optional)
If you want to define your own pre‑market times instead of relying on TradingView’s built‑in session, you can replace the isPreMarket line with a time‑range check. For example, isPreMarket = not na(time(timeframe.period, "0400-0930")) detects bars between 04:00 and 09:30 (U.S. Eastern time). You can parameterize the session string with input.session("0400-0930", "Pre‑Market Session") to let users adjust it.
オープンソーススクリプト
TradingViewの精神に則り、このスクリプトの作者はコードをオープンソースとして公開してくれました。トレーダーが内容を確認・検証できるようにという配慮です。作者に拍手を送りましょう!無料で利用できますが、コードの再公開はハウスルールに従う必要があります。
免責事項
この情報および投稿は、TradingViewが提供または推奨する金融、投資、トレード、その他のアドバイスや推奨を意図するものではなく、それらを構成するものでもありません。詳細は利用規約をご覧ください。
オープンソーススクリプト
TradingViewの精神に則り、このスクリプトの作者はコードをオープンソースとして公開してくれました。トレーダーが内容を確認・検証できるようにという配慮です。作者に拍手を送りましょう!無料で利用できますが、コードの再公開はハウスルールに従う必要があります。
免責事項
この情報および投稿は、TradingViewが提供または推奨する金融、投資、トレード、その他のアドバイスや推奨を意図するものではなく、それらを構成するものでもありません。詳細は利用規約をご覧ください。