OPEN-SOURCE SCRIPT
Moon Phases Prediction
🌙 Moon Phases (with Next Event Projection)
Introduction
This indicator plots Moon Phases (New Moon and Full Moon) directly on your chart.
In addition to showing historical phases, it also calculates and projects the upcoming next moon phase using precise astronomical formulas.
Features
How It Works
Customization
Use Cases
Notes
- The future moon event is displayed as a circle label on the correct date.
- If you cannot see the label, increase your chart’s right margin (Chart Settings → Scales → Right Margin).
- Calculations are approximate but astronomically accurate enough for trading or visual use.
Conclusion
This indicator is a simple yet powerful tool for traders interested in the influence of lunar cycles.
By combining historical phases with a projected next event, you can always be aware of where the market stands in the moon cycle timeline.
Introduction
This indicator plots Moon Phases (New Moon and Full Moon) directly on your chart.
In addition to showing historical phases, it also calculates and projects the upcoming next moon phase using precise astronomical formulas.
Features
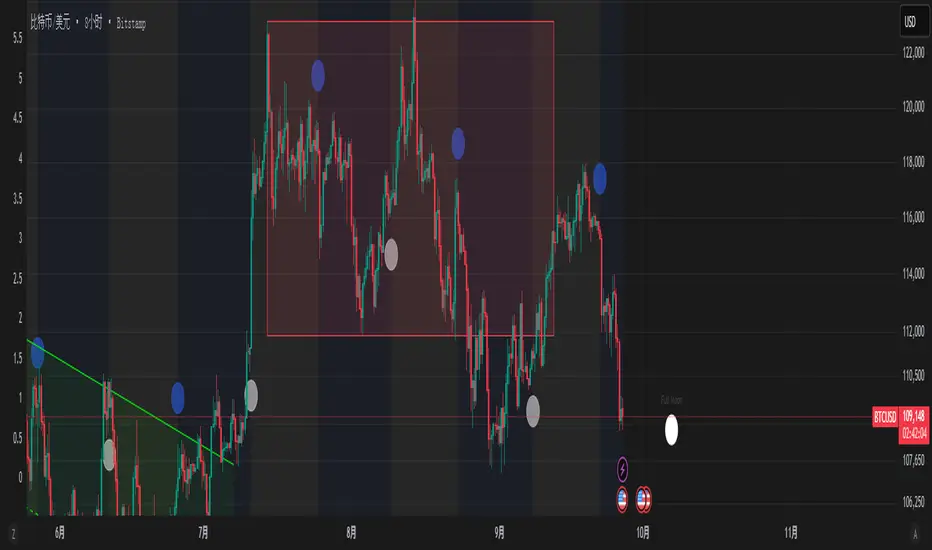
- Marks New Moons with circles above bars.
- Marks Full Moons with circles below bars.
- Dynamically adjusts background color based on waxing/waning phase.
- Calculates and displays the next upcoming moon event as a label positioned in the future.
- Works on all timeframes (except Monthly).
How It Works
- Uses astronomical approximations (Julian Day → UNIX time conversion).
- Detects the last occurred New Moon or Full Moon.
- Projects the next moon event by adding half a synodic month (~14.77 days).
- Displays the next event label at its exact future date on the chart.
Customization
- Waxing Moon color (default: Blue)
- Waning Moon color (default: White)
Use Cases
- Astro-finance: lunar cycles and market psychology.
- Trading strategies: aligning entries/exits with cyclical behavior.
- Visualization: adding an extra dimension of timing to chart analysis.
Notes
- The future moon event is displayed as a circle label on the correct date.
- If you cannot see the label, increase your chart’s right margin (Chart Settings → Scales → Right Margin).
- Calculations are approximate but astronomically accurate enough for trading or visual use.
Conclusion
This indicator is a simple yet powerful tool for traders interested in the influence of lunar cycles.
By combining historical phases with a projected next event, you can always be aware of where the market stands in the moon cycle timeline.
オープンソーススクリプト
TradingViewの精神に則り、この作者はスクリプトのソースコードを公開しているので、その内容を理解し検証することができます。作者に感謝です!無料でお使いいただけますが、このコードを投稿に再利用する際にはハウスルールに従うものとします。
微信 Wechat:yubolun001 (备注:TV)
------------
Binance 优惠:
accounts.binance.com/zh-CN/register?ref=X1PFQ12Z
Bitget 优惠:
partner.bitget.fit/bg/MRSHJ6
OKX 优惠:
okx.com/join/86487038
------------
Binance 优惠:
accounts.binance.com/zh-CN/register?ref=X1PFQ12Z
Bitget 优惠:
partner.bitget.fit/bg/MRSHJ6
OKX 优惠:
okx.com/join/86487038
免責事項
これらの情報および投稿は、TradingViewが提供または保証する金融、投資、取引、またはその他の種類のアドバイスや推奨を意図したものではなく、またそのようなものでもありません。詳しくは利用規約をご覧ください。