OPEN-SOURCE SCRIPT
Pre-Market High and Low
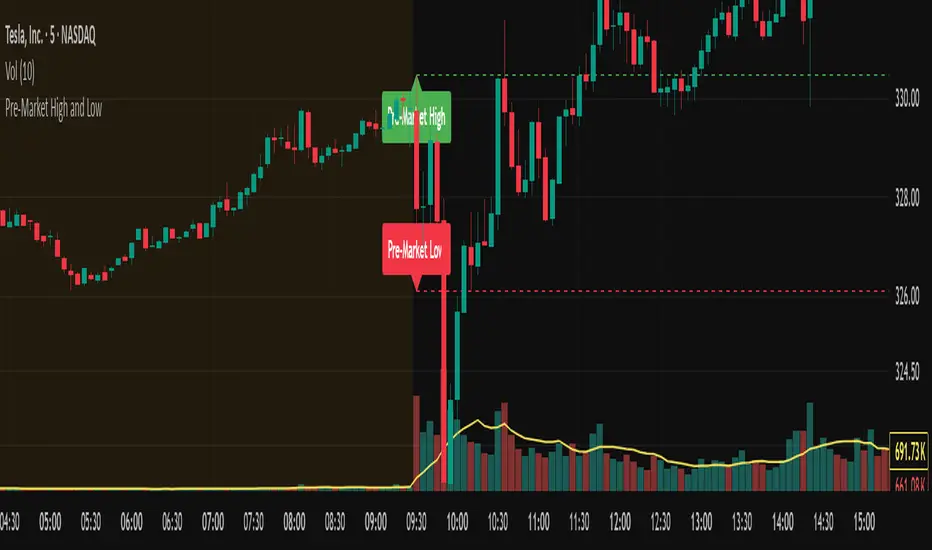
This indicator automatically tracks and plots the daily pre-market high and low levels on your chart for U.S. stocks. It monitors the pre-market session from 4:30 AM to 9:30 AM Eastern Time (New York) and captures the highest and lowest prices during this period.
At exactly 9:30 AM ET, when the regular market opens, the indicator draws dashed horizontal lines representing the pre-market high and pre-market low, extending them forward for better visibility throughout the trading day.
At exactly 9:30 AM ET, when the regular market opens, the indicator draws dashed horizontal lines representing the pre-market high and pre-market low, extending them forward for better visibility throughout the trading day.
オープンソーススクリプト
TradingViewの精神に則り、このスクリプトの作者はコードをオープンソースとして公開してくれました。トレーダーが内容を確認・検証できるようにという配慮です。作者に拍手を送りましょう!無料で利用できますが、コードの再公開はハウスルールに従う必要があります。
免責事項
この情報および投稿は、TradingViewが提供または推奨する金融、投資、トレード、その他のアドバイスや推奨を意図するものではなく、それらを構成するものでもありません。詳細は利用規約をご覧ください。
オープンソーススクリプト
TradingViewの精神に則り、このスクリプトの作者はコードをオープンソースとして公開してくれました。トレーダーが内容を確認・検証できるようにという配慮です。作者に拍手を送りましょう!無料で利用できますが、コードの再公開はハウスルールに従う必要があります。
免責事項
この情報および投稿は、TradingViewが提供または推奨する金融、投資、トレード、その他のアドバイスや推奨を意図するものではなく、それらを構成するものでもありません。詳細は利用規約をご覧ください。