PROTECTED SOURCE SCRIPT
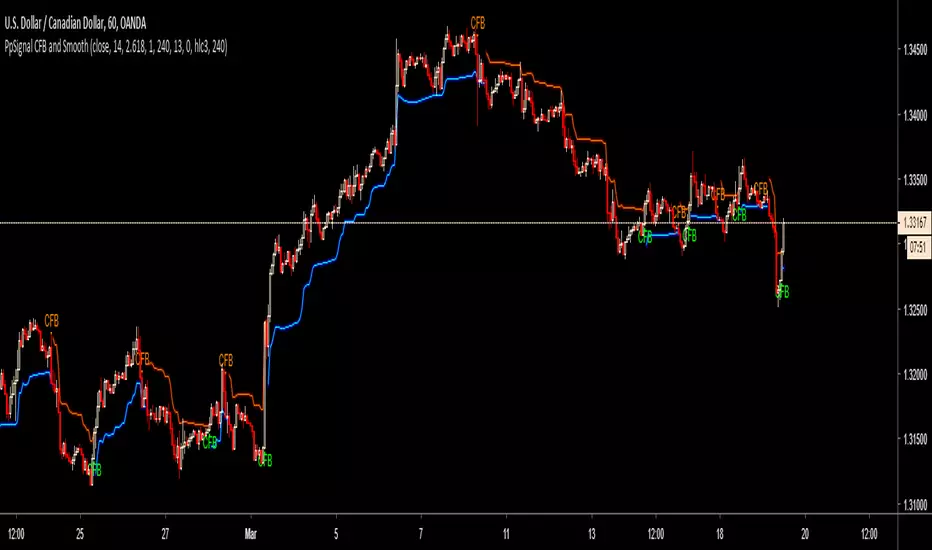
更新済 PpSignal CFB Alarm
What is the Theory Behind CFB ?
CFB tells you how long the market has been in a quality trend. This value can be used to adjust the period length of other indicators, especially stochastic bands.
In order to quantify the overall duration of a market's trend, we replaced classical cycle analysis methods (FFT, MEM, MESA) with a form of analysis that works even when no cycles exist. We accomplished this by examining a time series for specific fractal patterns of any size. We then gather all the patterns found and combine them into one overall index, CFB (Composite Fractal Behavior) Index.
For good reason, CFB does not analyze time series data for dominant cycles. Classical cycle analysis examines data points (e.g. prices) and estimates the average presence of a cycle in the window. Now suppose a cycle with a period length of 9 days was strong for 50 days and then disappeared for the next 14 days. Because the cycle was present for 50 out of the last (50+14=64) days, the average presence of that cycle would be measured as "strong" even though it does not exist anymore!
Does CFB find the Dominant Cycle ?
No! Consider the following discussion about the MYTH of exploiting dominant cycles.
It is true that the market does have predictable cycles due to its "structural" or physical nature. For example, quarterly earning cycles, triple witching cycles, Federal Reserve meetings, weekly cycles, political election year cycles, the annual end-of-year stock dumping cycle, sunspot cycles, and the slow Kitchin (3-5 years), Juglar (7-11 years), Kuznet (15-25 years) and Kondratieff (45-60 years) cycles. They are very predictable and the markets readily discount their presence as far ahead in time as is reasonable. So there's not much left with regard to those cycles for you to exploit.
What traders see as cycles on an hourly chart, for example, is a different matter. The big, obvious cycles you see on price charts are actually the result of a combination of many weak cyclic forces that sometimes line up in phase to produce APPARENT dominant cycles that suggest the presence of a strong structural cycle that, in fact, does not exist. The slightest shifting in phase of any one component (due to crowd psychology, unscheduled events, etc.) will significantly alter the structure of the apparent dominant wave. This may drive the cycle into a "null" or random period, then reappear, completely out of phase. Now you see it ... and now you don't.
The transitory nature of these apparent dominant cycles makes their automated detection difficult and forecast unreliable. Sometimes cycle forecasting tools appear accurate and other times they are totally off mark. The reason is that tools designed to spot dominant cycles will announce whatever they find, even if they are only apparent (not structural) and transitory. For example, such tools would have no problem detecting cycles in the six charts below. But there is just one problem --- the slow cyclic price action in the six charts below is *impossible* to project into the future with any reasonable accuracy!
Why? Because we produced these six charts by simply adding consecutive random price changes. That's right!! These charts are nothing more than RANDOM WALKS. And by definition, they cannot be forecasted, no matter how impressive their apparent cyclic behavior may be!
The chart above does not "prove" market cycles are non-existent. Indeed, discretionary traders can learn to spot and use periodic price events, and take time to "understand" their causes, in order to verify whether the relevant triggers have actually occurred.
This demonstration does show, however, that cycle-finding tools like FFT, MESA and periodigrams, which have no understanding of market cause-effect relationships, can be easily fooled into seeing ghosts. In contrast, our CFB tool was designed to measure market trending action without assuming the existance of cycles. This makes CFB more reliable.
How would I use CFB's results ?
CFB produces a value proportional to a time series' trend duration. This value is in units of TIME, as measured in bars on a chart. Because CFB's output is in units of time and not price, CFB offers a unique window into a new dimension for representing signal behavior.
Investors have discovered many profitable ways to apply CFB:
* To auto-adjust the lookback of classical indicators, such as RSI
* To auto-adjust the lookback depth of breakout channels in trending markets
* To auto-adjust the minimum amount of retracement needed to reverse position
Making a profit in the market requires your finding a unique niche that very few other people are exploiting. CFB offers this unique perspective.
Do I specify a "period length" for CFB?
In CFB, period length determines how many bars (time slices) are examined for specific fractal patterns. Due to the complexity of the algorithm, CFB permits only four period lengths: 24, 48, 96, 192. The 24-bar version can see trend fractals up to 24 bars wide, and so on. You get all four versions when ordering CFB.
________________________________
リリースノート
we added internal calc mtfリリースノート
we add cfb High Low break band保護スクリプト
このスクリプトのソースコードは非公開で投稿されています。 ただし、制限なく自由に使用できます – 詳細はこちらでご確認ください。
免責事項
この情報および投稿は、TradingViewが提供または推奨する金融、投資、トレード、その他のアドバイスや推奨を意図するものではなく、それらを構成するものでもありません。詳細は利用規約をご覧ください。
保護スクリプト
このスクリプトのソースコードは非公開で投稿されています。 ただし、制限なく自由に使用できます – 詳細はこちらでご確認ください。
免責事項
この情報および投稿は、TradingViewが提供または推奨する金融、投資、トレード、その他のアドバイスや推奨を意図するものではなく、それらを構成するものでもありません。詳細は利用規約をご覧ください。