OPEN-SOURCE SCRIPT
RVWAP ENHANCED
**Rolling VWAP with Alerts and Markers**
This Pine Script indicator enhances the traditional Rolling VWAP (Relative Volume Weighted Average Price) by adding dynamic features for improved visualization and alerting.
### Features:
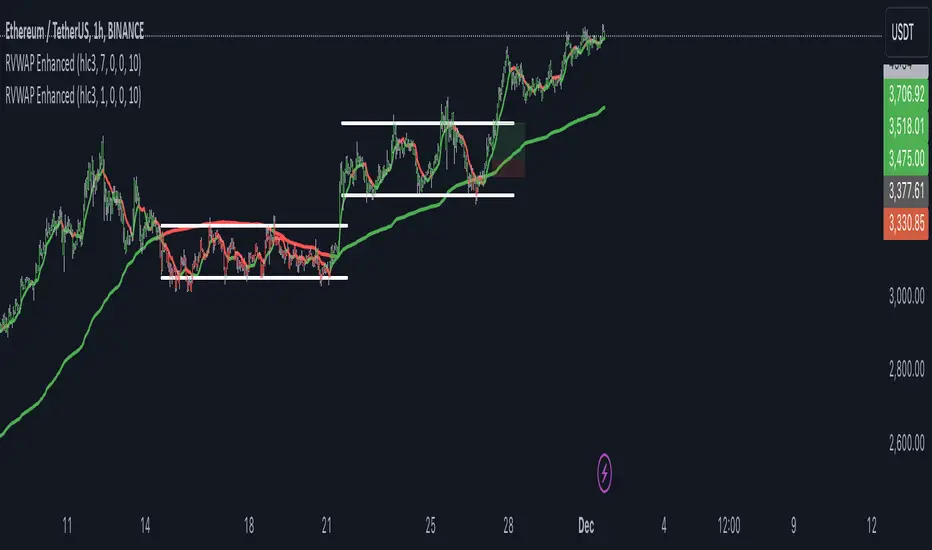
1. **Dynamic VWAP Line Coloring**:
- The VWAP line changes color based on the relationship with the closing price:
- **Green** when the price is above the VWAP.
- **Red** when the price is below the VWAP.
2. **Candle and Background Coloring**:
- **Candles**: Colored green if the close is above the VWAP and red if below.
- **Background**: Subtle green or red shading indicates the price’s position relative to the VWAP.
3. **Alerts**:
- Alerts notify users when the VWAP changes direction:
- "VWAP Turned Green" for price crossing above the VWAP.
- "VWAP Turned Red" for price crossing below the VWAP.
4. **Small Dot Markers**:
- Tiny dots are plotted below the candles to mark VWAP state changes:
- **Green dot** for VWAP turning green.
- **Red dot** for VWAP turning red.
5. **Custom Time Period**:
- Users can select either a dynamic time period based on the chart's timeframe or a fixed time period (customizable in days, hours, and minutes).
6. **Standard Deviation Bands (Optional)**:
- Standard deviation bands around the VWAP can be enabled for further analysis.
This script is designed to provide clear and actionable insights into market trends using the RVWAP, making it an excellent tool for traders who rely on volume-based price action analysis.
This Pine Script indicator enhances the traditional Rolling VWAP (Relative Volume Weighted Average Price) by adding dynamic features for improved visualization and alerting.
### Features:
1. **Dynamic VWAP Line Coloring**:
- The VWAP line changes color based on the relationship with the closing price:
- **Green** when the price is above the VWAP.
- **Red** when the price is below the VWAP.
2. **Candle and Background Coloring**:
- **Candles**: Colored green if the close is above the VWAP and red if below.
- **Background**: Subtle green or red shading indicates the price’s position relative to the VWAP.
3. **Alerts**:
- Alerts notify users when the VWAP changes direction:
- "VWAP Turned Green" for price crossing above the VWAP.
- "VWAP Turned Red" for price crossing below the VWAP.
4. **Small Dot Markers**:
- Tiny dots are plotted below the candles to mark VWAP state changes:
- **Green dot** for VWAP turning green.
- **Red dot** for VWAP turning red.
5. **Custom Time Period**:
- Users can select either a dynamic time period based on the chart's timeframe or a fixed time period (customizable in days, hours, and minutes).
6. **Standard Deviation Bands (Optional)**:
- Standard deviation bands around the VWAP can be enabled for further analysis.
This script is designed to provide clear and actionable insights into market trends using the RVWAP, making it an excellent tool for traders who rely on volume-based price action analysis.
オープンソーススクリプト
TradingViewの精神に則り、このスクリプトの作者はコードをオープンソースとして公開してくれました。トレーダーが内容を確認・検証できるようにという配慮です。作者に拍手を送りましょう!無料で利用できますが、コードの再公開はハウスルールに従う必要があります。
免責事項
この情報および投稿は、TradingViewが提供または推奨する金融、投資、トレード、その他のアドバイスや推奨を意図するものではなく、それらを構成するものでもありません。詳細は利用規約をご覧ください。
オープンソーススクリプト
TradingViewの精神に則り、このスクリプトの作者はコードをオープンソースとして公開してくれました。トレーダーが内容を確認・検証できるようにという配慮です。作者に拍手を送りましょう!無料で利用できますが、コードの再公開はハウスルールに従う必要があります。
免責事項
この情報および投稿は、TradingViewが提供または推奨する金融、投資、トレード、その他のアドバイスや推奨を意図するものではなく、それらを構成するものでもありません。詳細は利用規約をご覧ください。