OPEN-SOURCE SCRIPT
更新済 BBW, Squeeze, and EMA

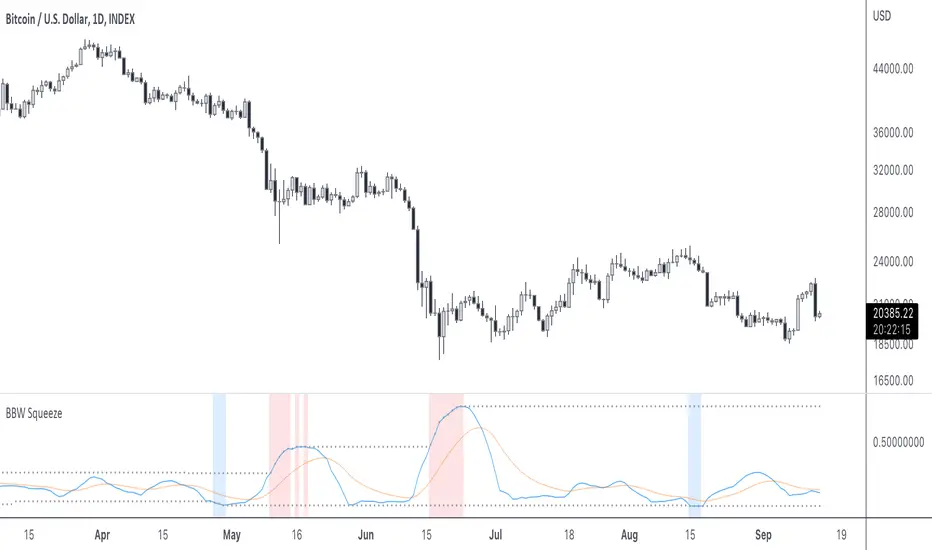
This indicator helps traders to identify low volatility areas by using the "Bollinger Bands Squeeze" method. The idea is to look for the lowest values in the Bollinger bands width to judge the lowest volatility readings.
By default the squeeze period is 125, as suggested by John Bollinger.
The indicator is a variation on the BB Squeeze indicator by @danarm. It adds:
* A lowest volatility print, named "Squeeze Line". This shows traders the lowest BBW reads.
* A moving average on top of BBW. This helps traders gauge volatility expansion. I'd use is like this: once you identify volatility contraction, an expansion would be when BBW crosses its average upwards.
* The blue background color indicates where BBW crossed its lowest 125 value, indicating further volatility contraction.
リリースノート
- Added "BBW Expansion" as well (useful for "unusual volatility alerts").
- Updated for Pine Script v5.
- Configurable "Highest Squeeze Period" now too.
オープンソーススクリプト
TradingViewの精神に則り、このスクリプトの作者はコードをオープンソースとして公開してくれました。トレーダーが内容を確認・検証できるようにという配慮です。作者に拍手を送りましょう!無料で利用できますが、コードの再公開はハウスルールに従う必要があります。
免責事項
この情報および投稿は、TradingViewが提供または推奨する金融、投資、トレード、その他のアドバイスや推奨を意図するものではなく、それらを構成するものでもありません。詳細は利用規約をご覧ください。
オープンソーススクリプト
TradingViewの精神に則り、このスクリプトの作者はコードをオープンソースとして公開してくれました。トレーダーが内容を確認・検証できるようにという配慮です。作者に拍手を送りましょう!無料で利用できますが、コードの再公開はハウスルールに従う必要があります。
免責事項
この情報および投稿は、TradingViewが提供または推奨する金融、投資、トレード、その他のアドバイスや推奨を意図するものではなく、それらを構成するものでもありません。詳細は利用規約をご覧ください。