OPEN-SOURCE SCRIPT
更新済 Bias Bar Coloring + Multi-Timeframe Bias Table + Alerts
Multi-Timeframe Bias Bar Coloring with Alerts & Table
This indicator provides a powerful, visual way to assess price action bias across multiple timeframes—Monthly, Weekly, and Daily—while also coloring each bar based on the current chart’s bias.
Features:
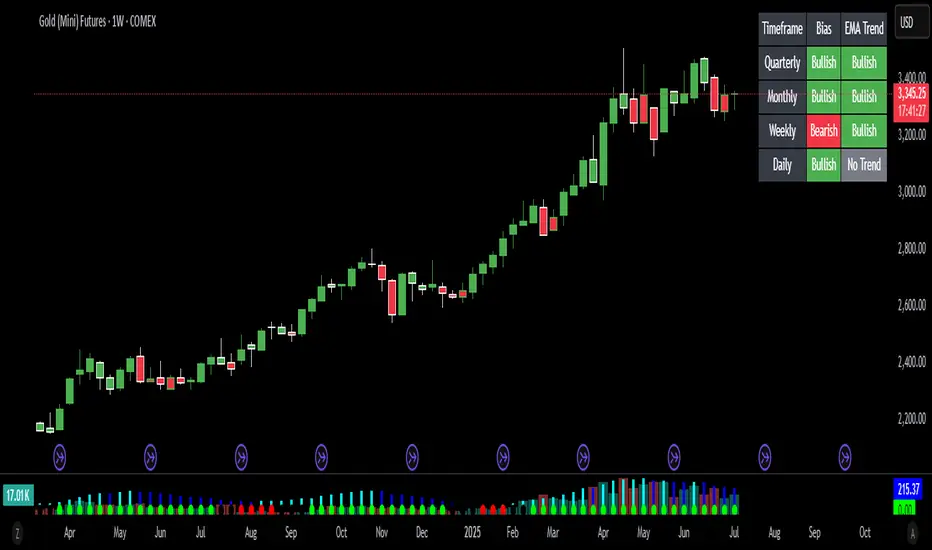
Persistent Bar Coloring: Bars are colored green for bullish bias (close above previous high), red for bearish bias (close below previous low), and persist the last color if neither condition is met. This makes trend shifts and momentum easy to spot at a glance.
Bias Change Alerts: Get notified instantly when the bias flips from bullish to bearish or vice versa, helping you stay on top of potential trade setups or risk management decisions.
Multi-Timeframe Bias Table: A table anchored in the top right corner displays the current bias for the Monthly, Weekly, and Daily charts, color-coded for quick reference. This gives you a clear view of higher timeframe context while trading any chart.
Consistent Logic: The same objective bias logic is used for all timeframes, ensuring clarity and reliability in your analysis.
How to Use:
Use the bar colors for instant visual feedback on trend and momentum shifts.
Watch the top-right table to align your trades with higher timeframe bias, improving your edge and filtering out lower-probability setups.
Set alerts to be notified of bias changes, so you never miss a potential opportunity.
This tool is ideal for traders who value multi-timeframe analysis, want clear visual cues for trend direction, and appreciate having actionable alerts and context at their fingertips.
This indicator provides a powerful, visual way to assess price action bias across multiple timeframes—Monthly, Weekly, and Daily—while also coloring each bar based on the current chart’s bias.
Features:
Persistent Bar Coloring: Bars are colored green for bullish bias (close above previous high), red for bearish bias (close below previous low), and persist the last color if neither condition is met. This makes trend shifts and momentum easy to spot at a glance.
Bias Change Alerts: Get notified instantly when the bias flips from bullish to bearish or vice versa, helping you stay on top of potential trade setups or risk management decisions.
Multi-Timeframe Bias Table: A table anchored in the top right corner displays the current bias for the Monthly, Weekly, and Daily charts, color-coded for quick reference. This gives you a clear view of higher timeframe context while trading any chart.
Consistent Logic: The same objective bias logic is used for all timeframes, ensuring clarity and reliability in your analysis.
How to Use:
Use the bar colors for instant visual feedback on trend and momentum shifts.
Watch the top-right table to align your trades with higher timeframe bias, improving your edge and filtering out lower-probability setups.
Set alerts to be notified of bias changes, so you never miss a potential opportunity.
This tool is ideal for traders who value multi-timeframe analysis, want clear visual cues for trend direction, and appreciate having actionable alerts and context at their fingertips.
リリースノート
Includes quarterly bias analysisIncludes MTF EMA trend analysis
リリースノート
Update to include option to move table to different areas on the chart and to change font sizeオープンソーススクリプト
TradingViewの精神に則り、このスクリプトの作者はコードをオープンソースとして公開してくれました。トレーダーが内容を確認・検証できるようにという配慮です。作者に拍手を送りましょう!無料で利用できますが、コードの再公開はハウスルールに従う必要があります。
免責事項
この情報および投稿は、TradingViewが提供または推奨する金融、投資、トレード、その他のアドバイスや推奨を意図するものではなく、それらを構成するものでもありません。詳細は利用規約をご覧ください。
オープンソーススクリプト
TradingViewの精神に則り、このスクリプトの作者はコードをオープンソースとして公開してくれました。トレーダーが内容を確認・検証できるようにという配慮です。作者に拍手を送りましょう!無料で利用できますが、コードの再公開はハウスルールに従う必要があります。
免責事項
この情報および投稿は、TradingViewが提供または推奨する金融、投資、トレード、その他のアドバイスや推奨を意図するものではなく、それらを構成するものでもありません。詳細は利用規約をご覧ください。