OPEN-SOURCE SCRIPT
Bollinger Bands Squeeze
📈 Bollinger Bands Squeeze
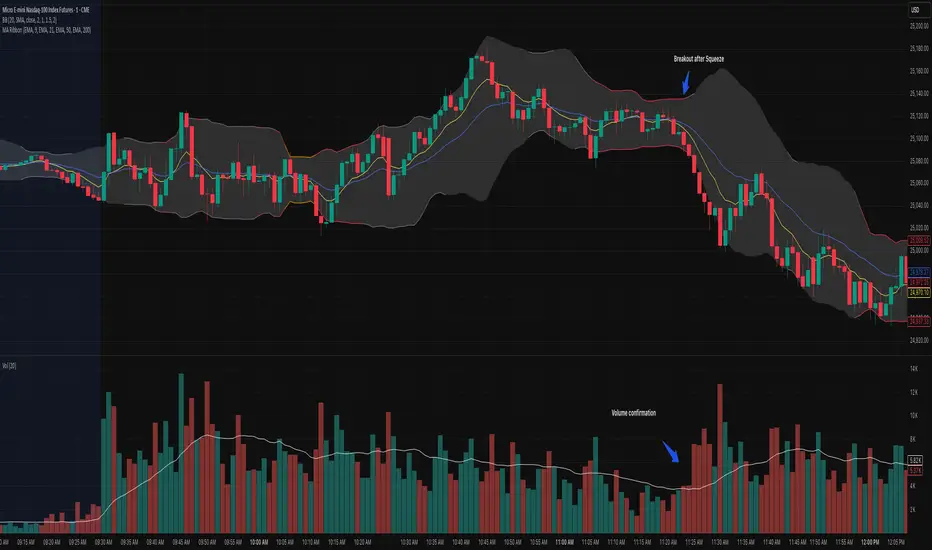
This indicator enhances traditional Bollinger Bands by integrating Keltner Channel layers to visualize market compression and volatility expansion — allowing traders to easily identify when a squeeze is building or releasing.
🔍 Overview
This is a refined version of the classic Bollinger Bands, designed to detect volatility squeezes using multiple Keltner Channel thresholds.
The script plots standard Bollinger Bands and dynamically colors the bands according to the degree of compression relative to the Keltner Channels.
⚙️ How It Works
Bollinger Bands are calculated from a selected moving average (SMA, EMA, SMMA, WMA, or VWMA) and standard deviation multiplier.
Keltner Channels are derived from ATR (True Range) using three sensitivity levels (1.0, 1.5, and 2.0× multipliers).
When Bollinger Bands contract inside a Keltner Channel, the script marks a squeeze state:
🟠 High Compression (Orange): Very tight volatility — expect breakout soon.
🔴 Mid Compression (Red): Moderate contraction — volatility is building.
⚫ Low Compression (Gray/Black): Early compression phase.
🧩 Inputs & Customization
Length: Period for both Bollinger and Keltner calculations.
Basis MA Type: Choose from SMA, EMA, SMMA (RMA), WMA, or VWMA.
StdDev Multiplier: Controls Bollinger Bandwidth.
Keltner Multipliers (1.0 / 1.5 / 2.0): Adjust compression thresholds.
Offset: Shifts the bands visually on the chart.
🕹️ Best Use Cases
Identify pre-breakout conditions before volatility expansion.
Combine with volume, momentum, or trend indicators (e.g., RSI) for confirmation.
Ideal for scalping, breakout trading, or volatility-based entries during session opens.
オープンソーススクリプト
TradingViewの精神に則り、このスクリプトの作者はコードをオープンソースとして公開してくれました。トレーダーが内容を確認・検証できるようにという配慮です。作者に拍手を送りましょう!無料で利用できますが、コードの再公開はハウスルールに従う必要があります。
免責事項
この情報および投稿は、TradingViewが提供または推奨する金融、投資、トレード、その他のアドバイスや推奨を意図するものではなく、それらを構成するものでもありません。詳細は利用規約をご覧ください。
オープンソーススクリプト
TradingViewの精神に則り、このスクリプトの作者はコードをオープンソースとして公開してくれました。トレーダーが内容を確認・検証できるようにという配慮です。作者に拍手を送りましょう!無料で利用できますが、コードの再公開はハウスルールに従う必要があります。
免責事項
この情報および投稿は、TradingViewが提供または推奨する金融、投資、トレード、その他のアドバイスや推奨を意図するものではなく、それらを構成するものでもありません。詳細は利用規約をご覧ください。