OPEN-SOURCE SCRIPT
Candle count, with simple number
What it does
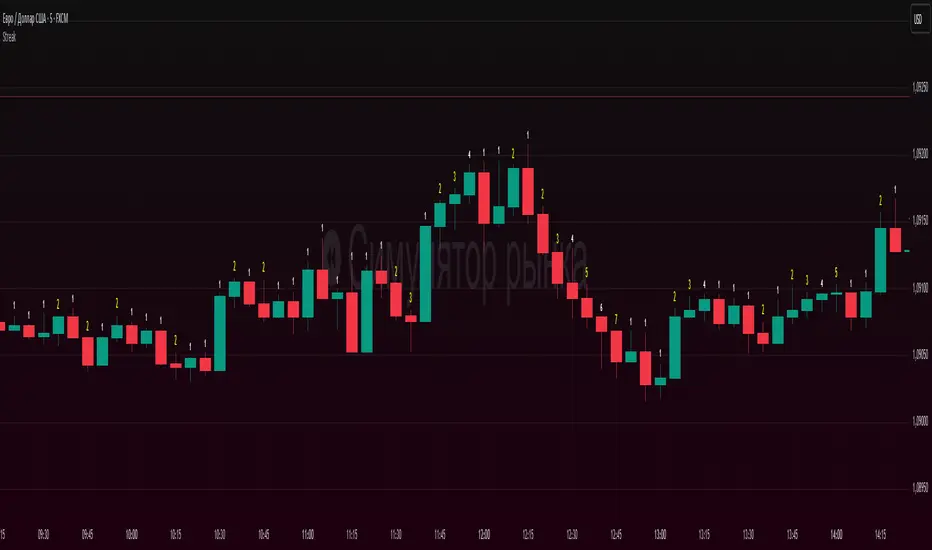
Counts the length of same-color candle streaks (consecutive bullish or bearish bars) and prints the running number above each bar:
e.g., “1, 2, 3…”; when color flips, it restarts at “1”.
Prime numbers (2, 3, 5, 7, 11, 13) are emphasized by rendering one size step larger and with a user-selected color.
Labels are pinned to each bar (anchored by bar index and price), so they do not drift when you pan or zoom the chart.
How it works
Determines candle direction: bullish if close > open, bearish if close < open.
If the current bar has the same direction as the previous bar, the counter increments; otherwise it resets to 1.
For values 2, 3, 5, 7, 11, 13 the number is highlighted (bigger + custom color).
Each number is drawn just above the bar’s High with a configurable offset.
The script does not repaint on history. During the live bar, the number updates in real time (as expected).
Settings
Digits size — Base text size (Tiny / Small / Normal / Large / Huge).
Prime numbers are automatically shown one step larger than the base size.
Offset above bar (ticks) — Vertical offset from the bar’s High, in instrument ticks.
Prime numbers color — Text color used specifically for prime numbers (non-prime digits are white).
How to read & use it
Rising momentum. Long streaks (e.g., 5–7+) suggest strong directional moves with few pullbacks.
Early pause/mean-reversion hints. After a long streak, the appearance of the opposite color (counter resets to “1”) often coincides with a pause or minor retrace.
Research & statistics. Quickly see which streak lengths are common on your market/timeframe (e.g., “How often do 3–5 bar runs occur?”).
Trade management. You can tie partial exits to specific streak lengths (2, 3, 5…) or reduce risk when the counter flips back to “1”.
Why it’s useful
Provides a clean, numeric view of momentum with zero smoothing or lag.
Works on any symbol and timeframe.
Prime-number emphasis makes important counts pop at a glance.
Pinned labels stay exactly above their bars, ensuring stable, readable visuals at any zoom level.
Notes
Doji bars (close == open) are treated as no direction and reset the streak.
This is a context tool, not a standalone buy/sell signal. Combine it with your entry/exit framework.
Very dense charts may hit platform label limits; the script raises the limit, but extremely long histories on very low timeframes can still be heavy.
オープンソーススクリプト
TradingViewの精神に則り、このスクリプトの作者はコードをオープンソースとして公開してくれました。トレーダーが内容を確認・検証できるようにという配慮です。作者に拍手を送りましょう!無料で利用できますが、コードの再公開はハウスルールに従う必要があります。
免責事項
この情報および投稿は、TradingViewが提供または推奨する金融、投資、トレード、その他のアドバイスや推奨を意図するものではなく、それらを構成するものでもありません。詳細は利用規約をご覧ください。
オープンソーススクリプト
TradingViewの精神に則り、このスクリプトの作者はコードをオープンソースとして公開してくれました。トレーダーが内容を確認・検証できるようにという配慮です。作者に拍手を送りましょう!無料で利用できますが、コードの再公開はハウスルールに従う必要があります。
免責事項
この情報および投稿は、TradingViewが提供または推奨する金融、投資、トレード、その他のアドバイスや推奨を意図するものではなく、それらを構成するものでもありません。詳細は利用規約をご覧ください。