OPEN-SOURCE SCRIPT
VWAP Bands @shrilss
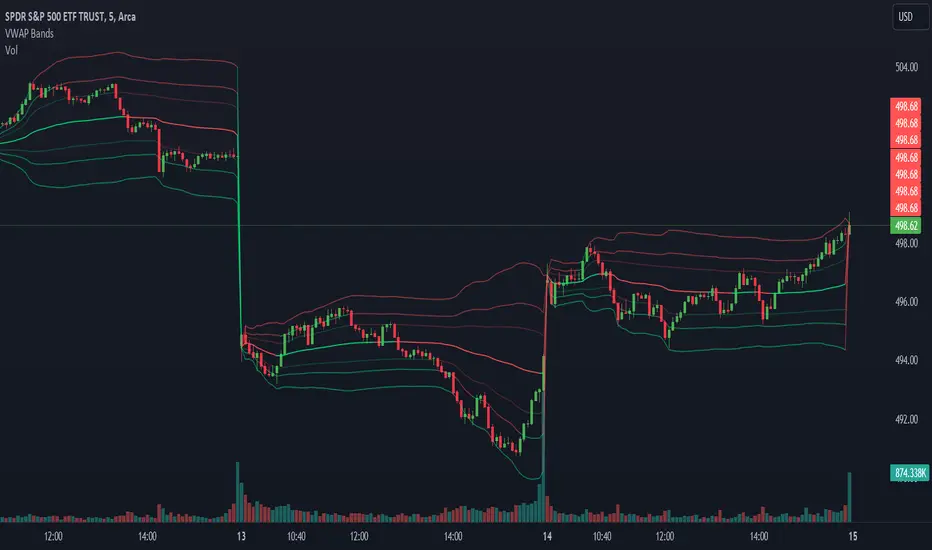
VWAP Bands Integrates VWAP with standard deviation bands to provide traders with insights into potential support and resistance levels based on volume dynamics. VWAP is a key metric used by institutional traders to gauge the average price a security has traded at throughout the trading day, taking into account both price and volume.
This script calculates the VWAP for each trading session and overlays it on the price chart as a solid line. Additionally, it plots multiple standard deviation bands around the VWAP to indicate potential areas of price extension or contraction. These bands are derived from multiplying the standard deviation of price by predetermined factors, offering traders a visual representation of potential price ranges.
This script calculates the VWAP for each trading session and overlays it on the price chart as a solid line. Additionally, it plots multiple standard deviation bands around the VWAP to indicate potential areas of price extension or contraction. These bands are derived from multiplying the standard deviation of price by predetermined factors, offering traders a visual representation of potential price ranges.
オープンソーススクリプト
TradingViewの精神に則り、このスクリプトの作者はコードをオープンソースとして公開してくれました。トレーダーが内容を確認・検証できるようにという配慮です。作者に拍手を送りましょう!無料で利用できますが、コードの再公開はハウスルールに従う必要があります。
免責事項
この情報および投稿は、TradingViewが提供または推奨する金融、投資、トレード、その他のアドバイスや推奨を意図するものではなく、それらを構成するものでもありません。詳細は利用規約をご覧ください。
オープンソーススクリプト
TradingViewの精神に則り、このスクリプトの作者はコードをオープンソースとして公開してくれました。トレーダーが内容を確認・検証できるようにという配慮です。作者に拍手を送りましょう!無料で利用できますが、コードの再公開はハウスルールに従う必要があります。
免責事項
この情報および投稿は、TradingViewが提供または推奨する金融、投資、トレード、その他のアドバイスや推奨を意図するものではなく、それらを構成するものでもありません。詳細は利用規約をご覧ください。