OPEN-SOURCE SCRIPT
更新済 Asset Correlation
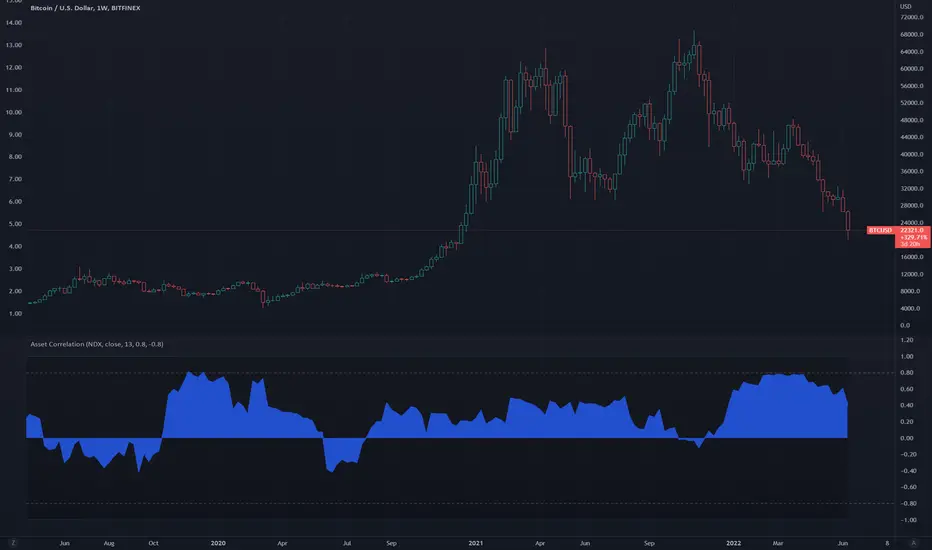
This indicator shows correlation strength between the source asset plotted in the main chart and a user-input asset in the indicator panel. For example, if the main chart panel is displaying BTCUSD and the correlation indicator is NDX, then the correlation strength is plotted as the relationship between the two. A strong positive correlation target is set at 0.80 but can be changed. A strong negative correlation target is set at -0.80 and can also be changed.
The indicator also has an option for a plot of the ta.correlation() function for a reference line.
The indicator also has an option for a plot of the ta.correlation() function for a reference line.
リリースノート
Changes as follows:- Fixed scale issue y axis for reference plot of ta.correlation(), which is hidden by default. As plots can’t be called from a local scope, the transparency of the plot is set to 100 when turned off which previously affected the y axis scale. Update sets ta.correlation() plot value to 0 and transparency to 100, when bShowTradingViewCorrelation is false.
オープンソーススクリプト
TradingViewの精神に則り、このスクリプトの作者はコードをオープンソースとして公開してくれました。トレーダーが内容を確認・検証できるようにという配慮です。作者に拍手を送りましょう!無料で利用できますが、コードの再公開はハウスルールに従う必要があります。
免責事項
この情報および投稿は、TradingViewが提供または推奨する金融、投資、トレード、その他のアドバイスや推奨を意図するものではなく、それらを構成するものでもありません。詳細は利用規約をご覧ください。
オープンソーススクリプト
TradingViewの精神に則り、このスクリプトの作者はコードをオープンソースとして公開してくれました。トレーダーが内容を確認・検証できるようにという配慮です。作者に拍手を送りましょう!無料で利用できますが、コードの再公開はハウスルールに従う必要があります。
免責事項
この情報および投稿は、TradingViewが提供または推奨する金融、投資、トレード、その他のアドバイスや推奨を意図するものではなく、それらを構成するものでもありません。詳細は利用規約をご覧ください。