OPEN-SOURCE SCRIPT
Implied and Historical Volatility v4
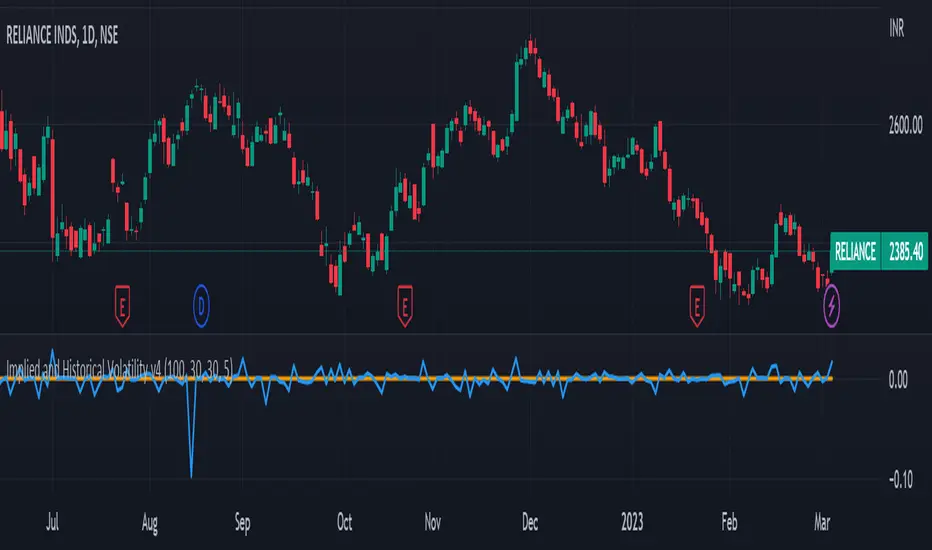
There is a famous option strategy📊 played on volatility📈. Where people go short on volatility, generally, this strategy is used before any significant event or earnings release. The basic phenomenon is that the Implied Volatility shoots up before the event and drops after the event, while the volatility of the security does not increase in most of the scenarios. 💹
I have tried to create an Indicator using which you
can analyse the historical change in Implied Volatility Vs Historic Volatility.
To get a basic idea of how the security moved during different events.
Notes:
a) Implied Volatility is calculated using the bisection method and Black 76 model option pricing model.
b) For the risk-free rate I have fetched the price of the “10-Year Indian Government Bond” price and calculated its yield to be used as our Risk-Free rate.
オープンソーススクリプト
TradingViewの精神に則り、このスクリプトの作者はコードをオープンソースとして公開してくれました。トレーダーが内容を確認・検証できるようにという配慮です。作者に拍手を送りましょう!無料で利用できますが、コードの再公開はハウスルールに従う必要があります。
免責事項
この情報および投稿は、TradingViewが提供または推奨する金融、投資、トレード、その他のアドバイスや推奨を意図するものではなく、それらを構成するものでもありません。詳細は利用規約をご覧ください。
オープンソーススクリプト
TradingViewの精神に則り、このスクリプトの作者はコードをオープンソースとして公開してくれました。トレーダーが内容を確認・検証できるようにという配慮です。作者に拍手を送りましょう!無料で利用できますが、コードの再公開はハウスルールに従う必要があります。
免責事項
この情報および投稿は、TradingViewが提供または推奨する金融、投資、トレード、その他のアドバイスや推奨を意図するものではなく、それらを構成するものでもありません。詳細は利用規約をご覧ください。