OPEN-SOURCE SCRIPT
VWMA Multiple Timeframes
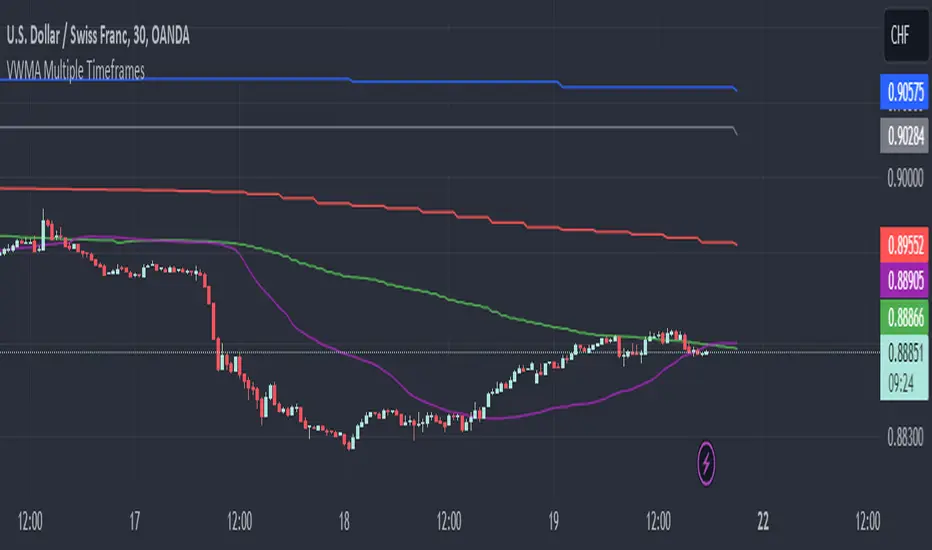
VWMA Multiple Timeframes Indicator
This TradingView indicator plots the Volume Weighted Moving Average (VWMA) across multiple timeframes on your chart. The VWMA is a type of moving average that gives more weight to periods with higher volume, making it a valuable tool for traders who want to incorporate volume into their technical analysis.
Features:
Multi-timeframe Analysis: This indicator calculates and plots the VWMA on five different timeframes:
Weekly (W)
Daily (D)
4 Hours (240 minutes)
1 Hour (60 minutes)
15 Minutes
Visual Representation: Each timeframe's VWMA is plotted with a different color, making it easy to distinguish between them on the chart:
Weekly VWMA: Gray
Daily VWMA: Blue
4 Hours VWMA: Red
1 Hour VWMA: Green
15 Minutes VWMA: Purple
How to Use:
Trend Identification: Use the VWMA to identify the direction of the trend on different timeframes. For example, if the VWMA is trending upwards on multiple timeframes, it indicates a strong upward trend.
Support and Resistance: The VWMA can act as dynamic support or resistance levels. Price bouncing off a VWMA line might indicate a continuation of the trend.
Volume Confirmation: The VWMA considers volume, making it useful for confirming the strength of price movements. High volume moves that cause the VWMA to change direction can be more significant than low volume moves.
This indicator is ideal for traders who use multi-timeframe analysis and want to incorporate volume into their trend and support/resistance identification. Feel free to customize the periods and timeframes to suit your trading style.
オープンソーススクリプト
TradingViewの精神に則り、このスクリプトの作者はコードをオープンソースとして公開してくれました。トレーダーが内容を確認・検証できるようにという配慮です。作者に拍手を送りましょう!無料で利用できますが、コードの再公開はハウスルールに従う必要があります。
免責事項
この情報および投稿は、TradingViewが提供または推奨する金融、投資、トレード、その他のアドバイスや推奨を意図するものではなく、それらを構成するものでもありません。詳細は利用規約をご覧ください。
オープンソーススクリプト
TradingViewの精神に則り、このスクリプトの作者はコードをオープンソースとして公開してくれました。トレーダーが内容を確認・検証できるようにという配慮です。作者に拍手を送りましょう!無料で利用できますが、コードの再公開はハウスルールに従う必要があります。
免責事項
この情報および投稿は、TradingViewが提供または推奨する金融、投資、トレード、その他のアドバイスや推奨を意図するものではなく、それらを構成するものでもありません。詳細は利用規約をご覧ください。