OPEN-SOURCE SCRIPT
IndiaView_IV
Disclaimer- This script is only for education purpose.
This script is special made for indiaview Friends.If u can learn about stock market. u can join. its free and always free of cost.
How to use this indicator-
Rules
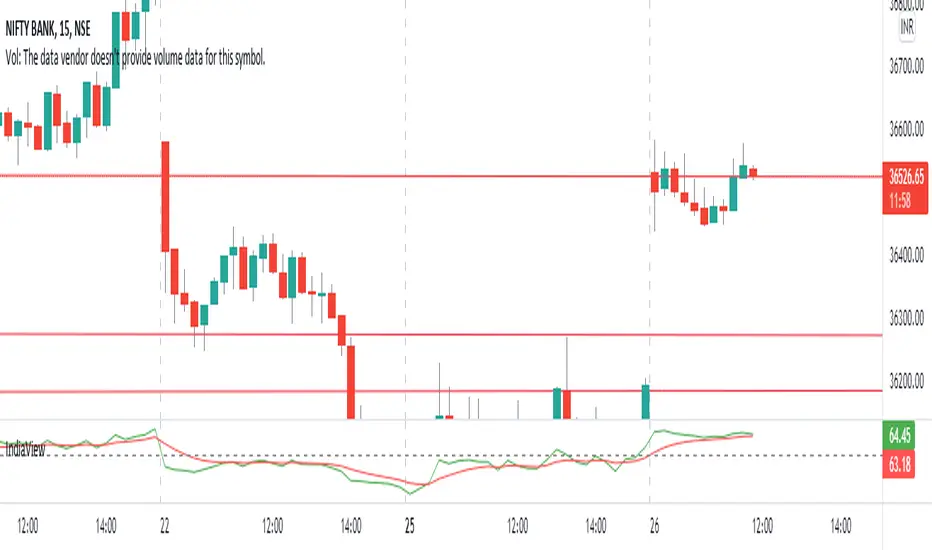
(i) No trend - when both lines are together the there is no trend in the market. only sideways market.
(ii) Bullish Market-Green Line above the red line mean bullish market.
(iii)Bearish Market-Red line above the green line means Bearish market.
50-50 line mean - Rsi line above the 50 the market may go Up. rsi below the 50 the market may go Down.
U Can use the indicator everywhere like Stock, future, options,currency, crypo and any other market.
This script is special made for indiaview Friends.If u can learn about stock market. u can join. its free and always free of cost.
How to use this indicator-
Rules
(i) No trend - when both lines are together the there is no trend in the market. only sideways market.
(ii) Bullish Market-Green Line above the red line mean bullish market.
(iii)Bearish Market-Red line above the green line means Bearish market.
50-50 line mean - Rsi line above the 50 the market may go Up. rsi below the 50 the market may go Down.
U Can use the indicator everywhere like Stock, future, options,currency, crypo and any other market.
オープンソーススクリプト
TradingViewの精神に則り、このスクリプトの作者はコードをオープンソースとして公開してくれました。トレーダーが内容を確認・検証できるようにという配慮です。作者に拍手を送りましょう!無料で利用できますが、コードの再公開はハウスルールに従う必要があります。
免責事項
この情報および投稿は、TradingViewが提供または推奨する金融、投資、トレード、その他のアドバイスや推奨を意図するものではなく、それらを構成するものでもありません。詳細は利用規約をご覧ください。
オープンソーススクリプト
TradingViewの精神に則り、このスクリプトの作者はコードをオープンソースとして公開してくれました。トレーダーが内容を確認・検証できるようにという配慮です。作者に拍手を送りましょう!無料で利用できますが、コードの再公開はハウスルールに従う必要があります。
免責事項
この情報および投稿は、TradingViewが提供または推奨する金融、投資、トレード、その他のアドバイスや推奨を意図するものではなく、それらを構成するものでもありません。詳細は利用規約をご覧ください。