PROTECTED SOURCE SCRIPT
Trend Momentum Algorithm
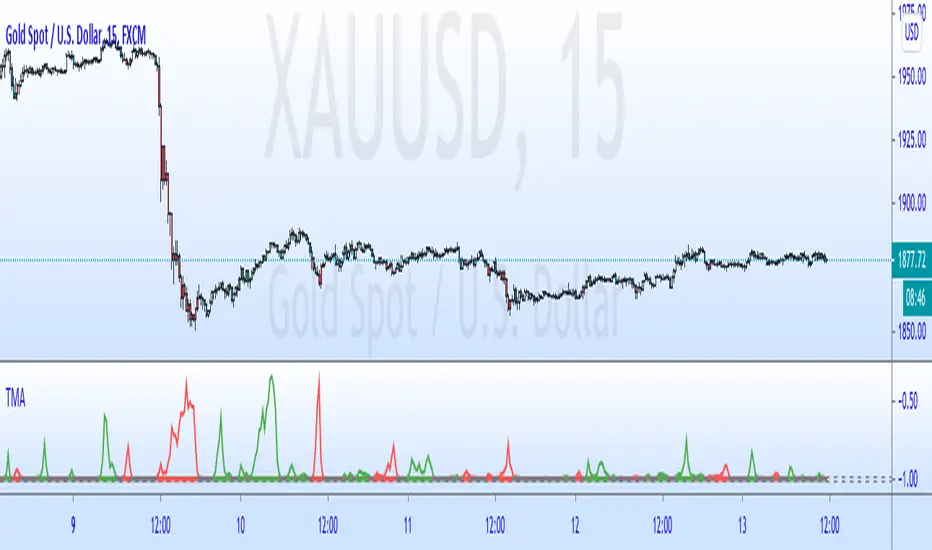
This algorithm comes from 2 inverse fisher transforms of a williams %R. After experimenting. I found that this is useful to understand the momentum of chart.
If green, only look for buy opportunities, if red, look for sells. If gray, look for whatever the previous colour was.
Can be useful with divergence. I'd look at a lower timeframe for confirmation (if divergence suggests turning bearish look for red on a lower timeframe. Be aware of the momentum on the timeframe above)
I put a tolerance filer on to help remove any smaller spikes. The larger the tolerance the less inaccuracies you will have but see the start of an new trend later.
This is a fun tool. Enjoy
保護スクリプト
このスクリプトのソースコードは非公開で投稿されています。 ただし、制限なく自由に使用できます – 詳細はこちらでご確認ください。
免責事項
この情報および投稿は、TradingViewが提供または推奨する金融、投資、トレード、その他のアドバイスや推奨を意図するものではなく、それらを構成するものでもありません。詳細は利用規約をご覧ください。
免責事項
この情報および投稿は、TradingViewが提供または推奨する金融、投資、トレード、その他のアドバイスや推奨を意図するものではなく、それらを構成するものでもありません。詳細は利用規約をご覧ください。