OPEN-SOURCE SCRIPT
bgeraghty_FibCast
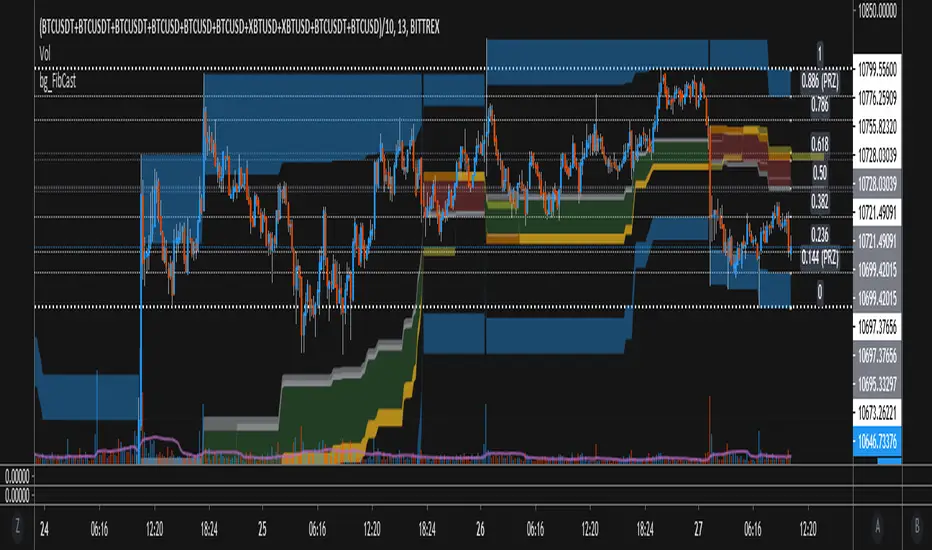
This script draws a High-To-Low or Low-To-High Fibonacci Retrace over the chart, based on which of those two happens in the given time period (Default is 144 Candles).
Updates from older versions:
- Paints 0.5, 0.618, 0.65 and spaces in between, giving good hindsight to the trend, and ideas of where strong support/resistance may lie.
- Silver Paint Strip = 0.50 retrace, Gold = 0.618-0.65, and the Red/Green between indicates the direction of the (Fib) Trend as H->L or L->H
- Paints 0.144 and 0.886 ranges Blue, and these are typically extremes or possible reversal zones. (PRZ)
オープンソーススクリプト
TradingViewの精神に則り、このスクリプトの作者はコードをオープンソースとして公開してくれました。トレーダーが内容を確認・検証できるようにという配慮です。作者に拍手を送りましょう!無料で利用できますが、コードの再公開はハウスルールに従う必要があります。
免責事項
この情報および投稿は、TradingViewが提供または推奨する金融、投資、トレード、その他のアドバイスや推奨を意図するものではなく、それらを構成するものでもありません。詳細は利用規約をご覧ください。
オープンソーススクリプト
TradingViewの精神に則り、このスクリプトの作者はコードをオープンソースとして公開してくれました。トレーダーが内容を確認・検証できるようにという配慮です。作者に拍手を送りましょう!無料で利用できますが、コードの再公開はハウスルールに従う必要があります。
免責事項
この情報および投稿は、TradingViewが提供または推奨する金融、投資、トレード、その他のアドバイスや推奨を意図するものではなく、それらを構成するものでもありません。詳細は利用規約をご覧ください。