OPEN-SOURCE SCRIPT
更新済 QQE Student's T-Distribution Bollinger Bands Screener
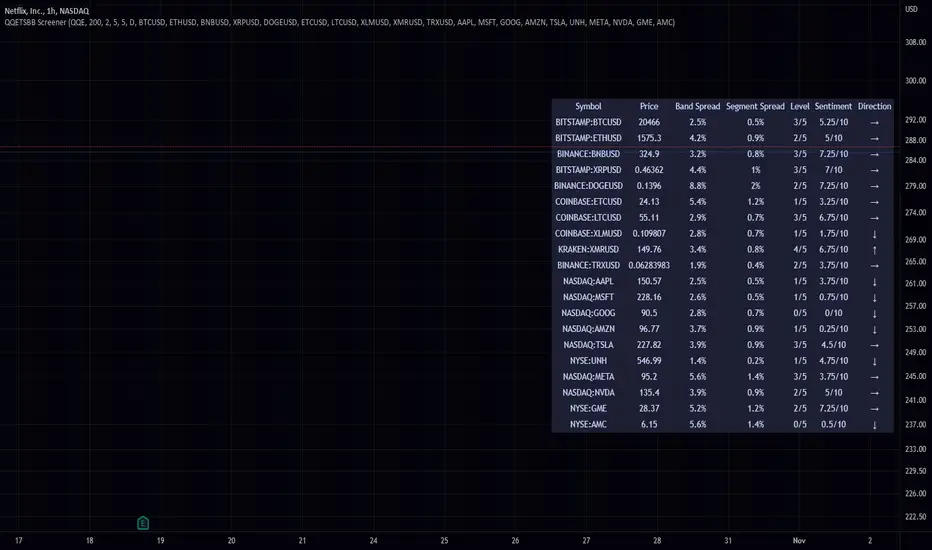
This script scans 20 custom symbols and displays the QQE Students T-Distribution Bollinger Bandwidth as a percentage, the quarter segment percentage, a score that tells you what segment of the band the price is in, and what direction the market is going in. This is useful because it can tell you how volatile a market is and how much reward is in the market. It also tells you what direction the market is going in so you can pick a symbol that has the best looking reward. I really hope that this script complements the group of indicators I have made so far. Here is a list of the other two indicators related to this script.


Please enjoy!
Please enjoy!
リリースノート
added price lolリリースノート
added the option to use traditional moving averages instead of the qqe.リリースノート
Added tool tips and a sentiment tracker. I renamed Score to Level.リリースノート
middle right is more practical リリースノート
added a symbol group and rearranged the code a bit. リリースノート
Updated the sentiment score to reflect the changes I made to the oscillator. ie I added heikin ashi to the scoreing system. (that being said its actually line break heikin ashi!)リリースノート
made it usable for every oneリリースノート
Now you can change the location on your screen.リリースノート
fixed bugオープンソーススクリプト
TradingViewの精神に則り、このスクリプトの作者はコードをオープンソースとして公開してくれました。トレーダーが内容を確認・検証できるようにという配慮です。作者に拍手を送りましょう!無料で利用できますが、コードの再公開はハウスルールに従う必要があります。
免責事項
この情報および投稿は、TradingViewが提供または推奨する金融、投資、トレード、その他のアドバイスや推奨を意図するものではなく、それらを構成するものでもありません。詳細は利用規約をご覧ください。
オープンソーススクリプト
TradingViewの精神に則り、このスクリプトの作者はコードをオープンソースとして公開してくれました。トレーダーが内容を確認・検証できるようにという配慮です。作者に拍手を送りましょう!無料で利用できますが、コードの再公開はハウスルールに従う必要があります。
免責事項
この情報および投稿は、TradingViewが提供または推奨する金融、投資、トレード、その他のアドバイスや推奨を意図するものではなく、それらを構成するものでもありません。詳細は利用規約をご覧ください。